Property prices can be hard to predict sometimes. Outcomes don’t always go to plan and there will always be the surprise results that we call anomalies. Every time we meet a home buyer and commence the assignment with our new client we discuss the need for our assignment to focus on areas and dwelling types that are likely to fall within their budget, as opposed to sifting the market for those anomaly properties.
Excessive time in a positively trending market can cost buyers more than just time and sanity.
The cost of lost time represents a real dollar value.
The search must also canvas the market for anomalies though, because while they are rare and infrequent, they do exist. Missing out on a good quality property that suits the criteria and sells within the budget is completely disheartening for a buyer, but wasting money on building inspections and due diligence on every ‘maybe’ home is frustrating as well.
In a mathematical context, these anomaly properties are the data points that are outliers on the bell curve.
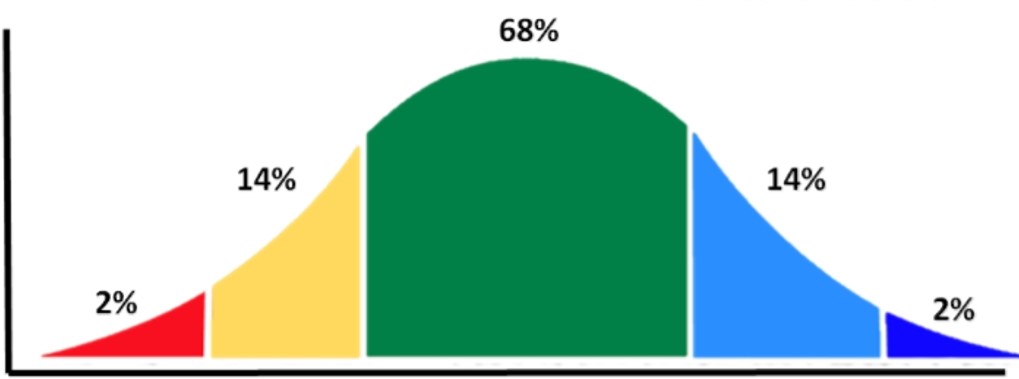
When we set out the search parameters for a new assignment, we ensure that our client’s focus is on the properties which are likely to fall in the green colour of the bell curve. Their chances of success in a reasonable amount of time is considerably higher. We obviously get excited about those options in the pale blue space, but a feasible brief is the approach at the start.
The yellow represents the sales results which lie between one and two standard deviations of the mean. These are the results that are particularly strong and surprising. A buyer may be prepared to pay a premium price for a property if their criteria is very strict and specific, and the frequency of such properties hitting the market is very low. The sales figure by any person’s measure would be considered a strong result but not a crazy one.
Likewise the pale blue represents a sale figure which is lower than anticipated but not an anomaly. Such results would be considered good buys.
The red and dark blue represent those sales which genuinely are the ‘five percenters’; those crazy results where anyone in our industry would wonder what happened at the auction to fuel a crazy result, or what went wrong with the campaign to enable such an opportunistic purchase.
It is the dark blue segment of the chart which can be completely exhilarating for a buyer when the purchase price sits more than two standard deviations from the mean.
But focusing on buying within this segment of the bell curve can represent heartache.
It certainly is a factor of probability, and wasting time and energy on this segment can get expensive.
Recognising when to prepare for an auction and when to let the opportunity pass comes down to more than science. It requires careful questioning of the agent.
Asking the right questions can help buyers decipher between properties which could creep into the yellow or red sections of the curve from those that should sit firmly in the green section. Avoiding a red segment auction can save a lot of time, heartache and due diligence money. Some of the indicators for such a property will come down to the following;
- The likely number of genuine bidders. This can seem as difficult information to tease out of an agent, but asking the direct question is a start. Requesting from the agent the number of total inspections throughout the campaign, the number of requests for contract, the number of building inspections conducted and whether any advocates (how many?) are attending the auction to bid will give a firmer indication of the likely number of bidders.
- Recognising the scarcity of the property is vital. If properties of it’s calibre come onto the market infrequently a buyer must anticipate a tough auction with fierce emotion-driven competition.
- Assessing the market for any competing properties is helpful. If a particular genre of dwelling in a given area is over-represented at any one time, buyer interest will be watered down and while a campaign may attract multiple interested parties, some of these buyers may decide to bid on the alternative competing properties and the auction result may be lower than anticipated. Spring is an interesting market for such conditions and it is the time that as advocates, we see more results in the blue segments of the chart.
Only last month we bid for a client on a revered piece of land in Bellarine’s beautiful Portarlington. The elevated block with panoramic bay vista had been the subject of many agent inquiries over the decades and when we asked about the scarcity of the block, the agent advised that she’d had people knocking on her door for years, asking “if that property ever comes up for sale, can you call me?”

Every local was out to watch the auction. The local Lions Club were barbequing sausages for everyone. We knew it was going to be a showdown and so did our buyer. His allocated budget took into account the scarcity and popularity of the block. We did secure it and we knew we had a budget that was outside of the green section of the curve. But could we replicate the opportunity? Absolutely not. It was this block, or never again.
One year ago in the vibrant spring market in Melbourne’s inner west, we bid on a 1950’s house in West Footscray for dear clients who had missed out on many similar properties over a bleak winter of limited stock supply. We recognised that there were competing properties in the area representing similar dwelling styles, but we still felt that they had quite an unlikely chance of success with their allocated budget. It was the last auction of the day for us and we all acknowledged that our chances were slim but we knew our buyers would have deep regret if the property sold to another buyer within budget. To our shock, only one of the many identified potential bidders actually bid. Others had decided throughout the campaign that they’d be in the crowd but would bid on alternative properties. The other bidder’s budget was surprisingly low and the reserve was declared.
My one thousand dollar bid above his secured the property.
Our clients were in complete disbelief and we knew that they had achieved an anomaly result that day. In the face of comparable sales indicating a likely price of circa early nines, we purchased for less than mid eights. This was a result possibly in the dark blue section of the curve.
Yesterday we made the call to scale up for auction, arguably potentially facing the yellow section of the bell curve, but with hopes of achieving a blue result.
Spring can be full of surprises, and happily for our client we did achieve a thrilling result for them.
Being ‘in it to win it’ is sometimes just the key.
But focusing on searching firmly in the heart of the bell curve is the secret to a feasible and realistic search.
REGISTER TO OUR NEWSLETTER
INFORMATION
CONTACT US
1A/58 ANDERSON STREET,
YARRAVILLE VIC 3013
0422 638 362
03 7000 6026
CATE@CATEBAKOS.COM.AU