We’re not feeling what the media are reporting

The title may sound surprising, but this isn’t the first time our coal face has felt quite different to what’s being reported. Sometimes data is lagged and the pace of change isn’t yet showing in the data, but this time is a little bit different.
Our supply and demand ratio is lower than past months, in fact our supply is so low that this ratio has potentially saved more considerable price falls in the cities with relative undersupply.
Vendor listing activity is low for a number of reasons. Many vendors made big, bold decisions during COVID lockdowns, particularly in Victoria. We had a rush of vendors who were seeking greener pastures, larger houses, and (for many), a regional or interstate move.
Many vendors made decisions in 2020 and 2021.
For many, 2022 has represented a chance to settle in and consolidate their new lifestyle.
For the others who have a future plan to upgrade, downsize or move, the reported market conditions are not exactly conducive to a great result. Hence, we’re seeing only the motivated vendors making a decision to sell.
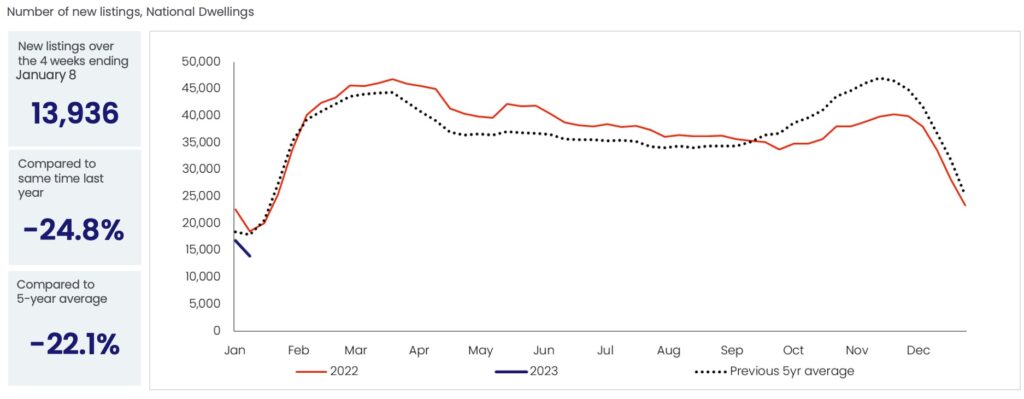
Listing numbers waned into the second half of 2022, almost in perfect correlation with our interest rate increases. Our winter listing volumes, (which are typically our tightest after January) were greater than our spring/summer market listings.
Compared to our five year average for this time of year, we are currently sitting at 22.1% below.
It seems vendors still have limited appetite for selling.
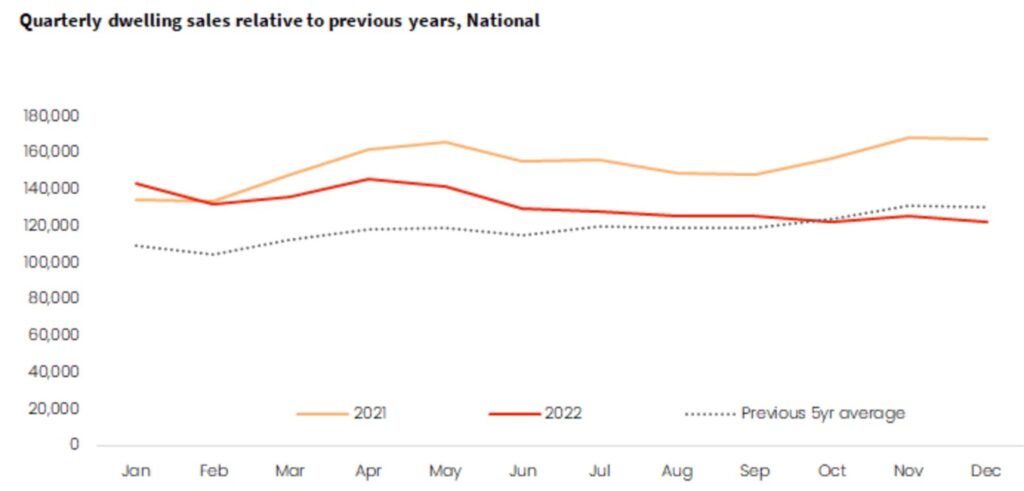
Naturally, sales values broadly reflected limited listing activity. Less properties for sale equates to less sales activity. Interestingly, we noted that the total stock volume deteriorated again as motivated buyers took up not only the new listings, but older listings also.
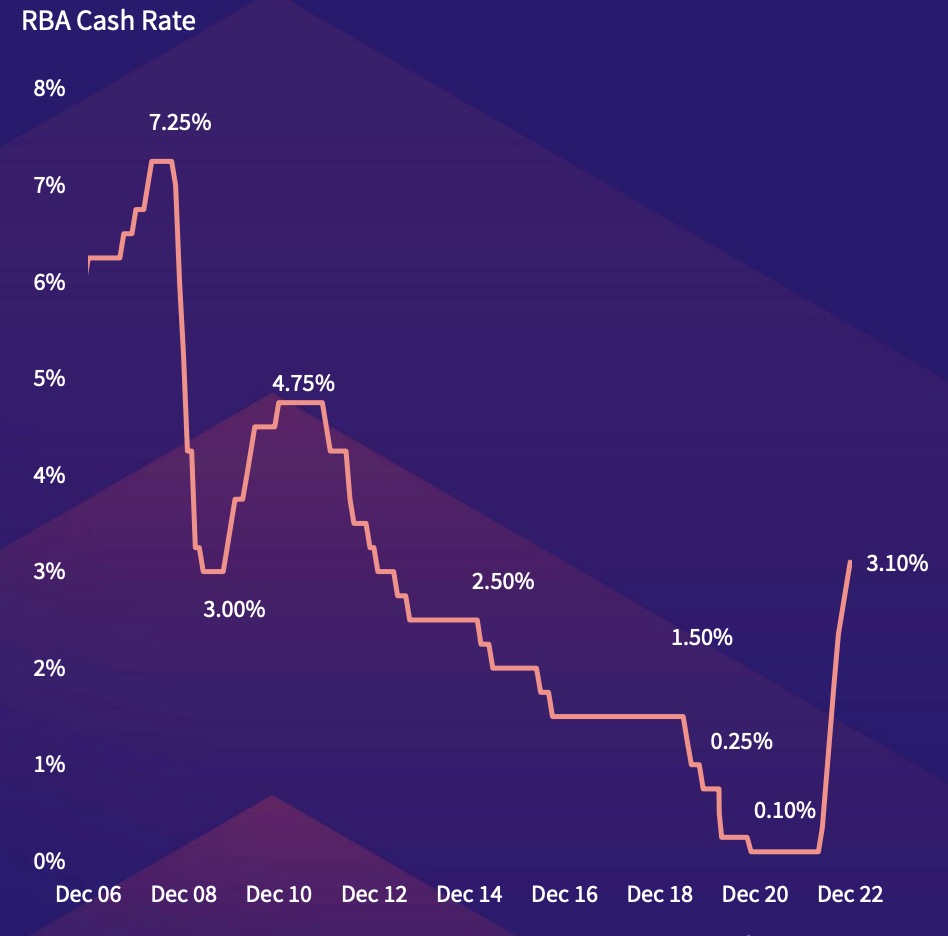
When we overlay the RBA cash rate moves with vendor participation, its a remarkable correlation.
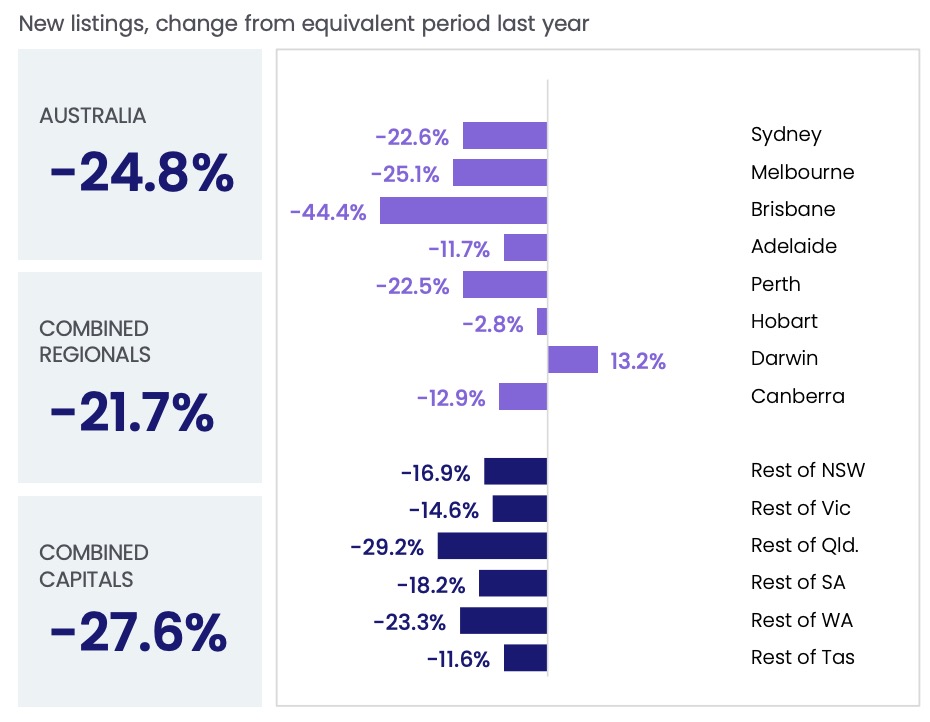
The individual capital city data shows that Brisbane listings have been the most impacted, followed by Melbourne, then Sydney and Perth. Both Darwin and Hobart listings contrasted that of every other capital, with heightened listing activity in both of these smaller cities.
Possibly an elastic reaction to the tree-change moves during COVID?
The chart below shows the impact of the pandemic and our interest rate increases over a ten year period. Our stock supply is substantially lower than the past ten year average.
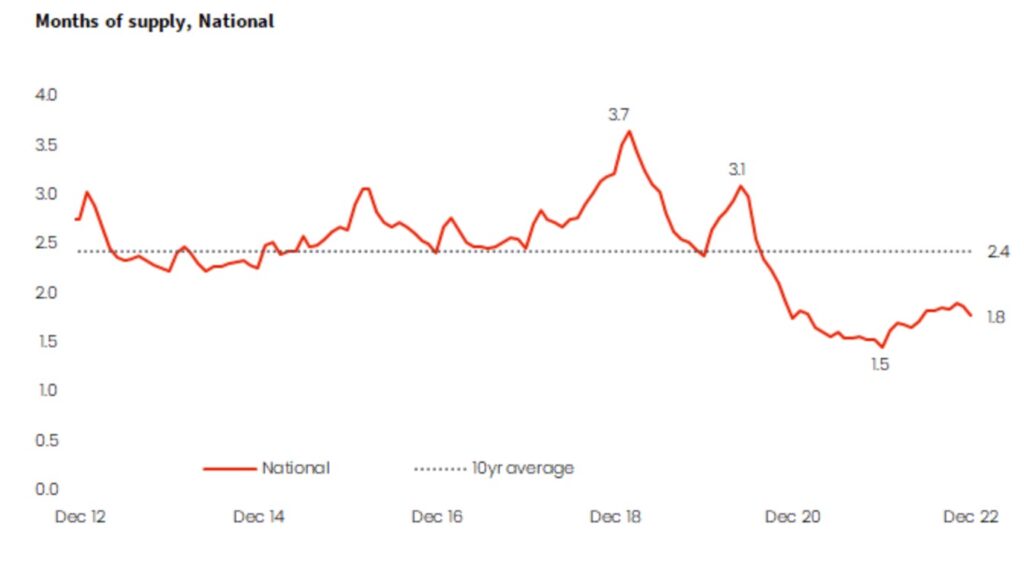
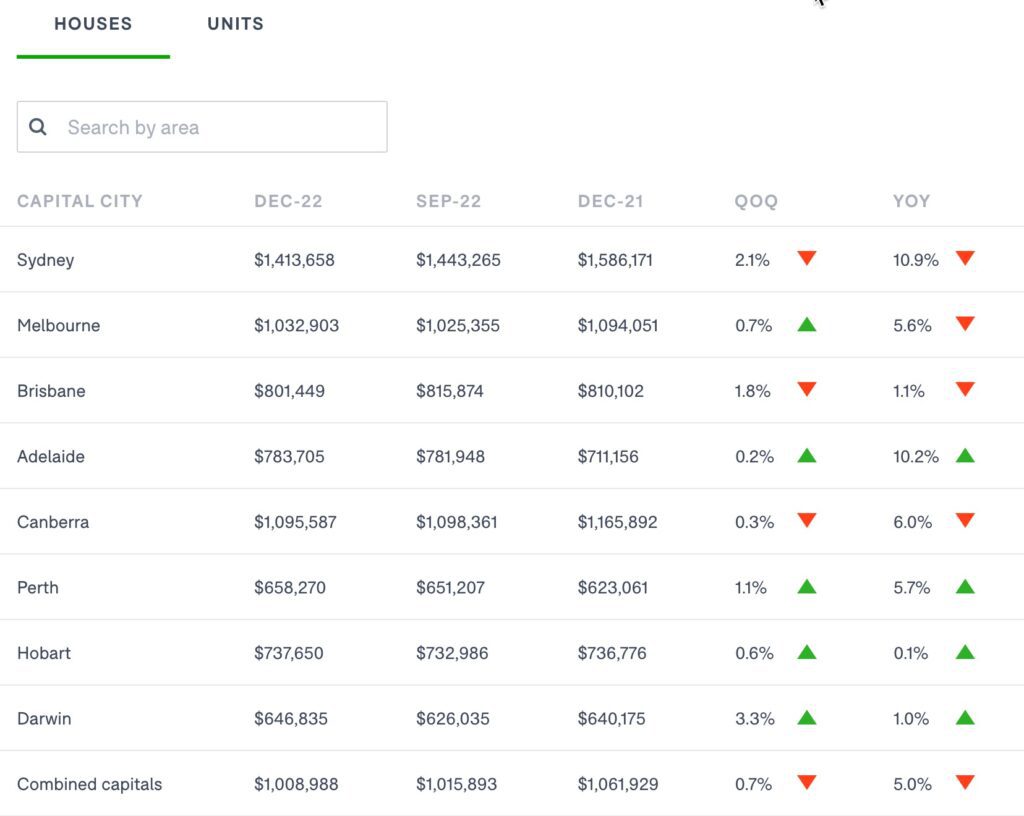
As always happens when supply and demand ratios are not in balance, quite a few of our capital cities have experienced price stabilisation, (and for some) slight price increases. Note that this Domain chart below is for houses. Units tell a a slightly different story.
As the rate of interest rate increases slow, and more pressingly, once our cash rate is determined to be at equilibrium, we can expect more buyers will leap forward with more confidence.
But until vendors decide that the time to sell is optimal, a stock shortage may continue to support price falls during rising interest rates.
Our late December and January auction activity has not felt much like a buyer’s market, particularly for houses. We’ve had tough competition at every turn; a sign of undersupply and motivated house buyers.
Supply and demand is so fascinating in the world of real estate.