Resetting Price Expectations

When markets adjust abruptly, typical analytical routines can become very challenging. In the property industry, the reliability of relevant data such as comparable sales comes into question, and it’s not just agents who struggle to keep up. Buyers and vendors also experience confusion around price expectation because their data points are changing at a rapid rate.
Our market turned a corner quickly on the night of Saturday 18 May. Sentiment was the root cause, spurred on by a surprise election win, an earlier rate cut and talk of lenders relaxing their servicing buffers.
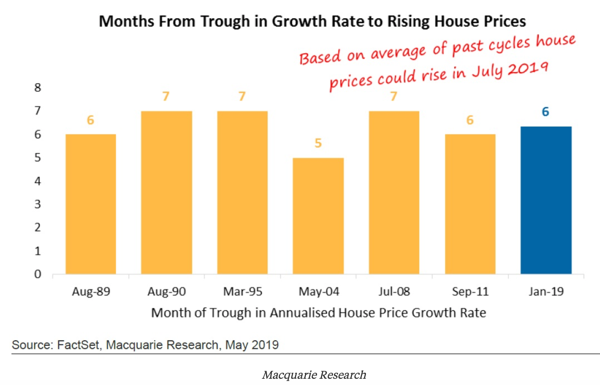
It seems that Macquarie may have been one of the first to call the turnaround, and their prediction of July recording positive growth became reality, (based on length of time from trough, taking into account past market cycles) – see second chart below.
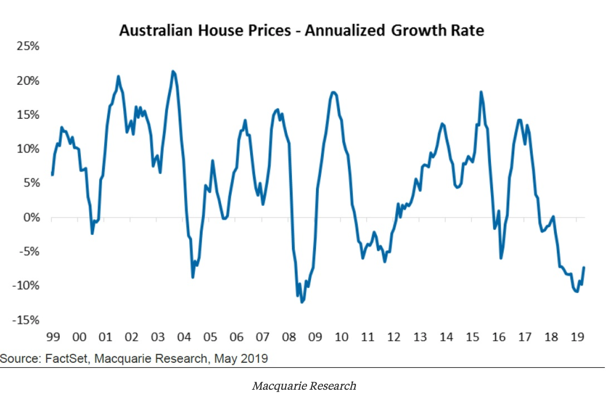
Our August data (albeit a lagging report based on many sales results yet to be registered/settle), clearly shows the positive green shoots of what could be a market in recovery.
The question is – how do we navigate the market in the face of rapid change?
Comparable sales analysis has typically been the favoured assessment tool of the valuer, the selling agent, the buyer’s agent and consumers who like to rely on some degree of science. Data portals such as RP Data (pictured below) generally show results in real time (despite the *undisclosed* results) and for those of us who pay our monthly fees and subscribe, we are privy to sales results, dates of sale, land sizes, zoning, previous sales and an abundance of other data.

What we can’t get insight into is vendor motivation for any given campaign, nor does the portal highlight an anomaly result.
We need to rely on our understanding of market conditions over the past few years, and often we tap into a selling agent’s recollection of a campaign and the conditions that lead to an anomaly result.
Importantly though, we need to know which date ranges to avoid collating data from when our market is no longer aligned with that date range.
In other words; we cannot use sales results spanning the lowest confidence levels of our recent market when comparing to our current market.
We can’t use pre-election sales results for comparable sales analysis now.
So how can we assess likely selling prices of current stock if we have an insufficient number of post-election sales results available?
There are a few methods, two of which are namely;
Overlaying a nominal percentage change– where we adjust our expectation using past data, overlaying it with a known and proven percentage variation. For example, if we know that Coburg, for example, has delivered 5% capital growth since May 209, we could take an average price in the pre-election time frame for a particular dwelling type, (eg. villa units) and overlay a 5% premium onto this figure to deliver an adjusted value. This method is not easy to adopt though, as specific property sales data is not easy to plot with a percentage growth figure. No data firm individually plots price movement for specific dwelling types; we only capture houses and units. This methodology would work optimally in the share market, where a packet of shares for one company are each identical.
The property market is distinctly different though. Properties are unique. Average growth figures for various pockets, styles, dwelling types and sizes vary. And that’s not counting the anomalies.
Another method is to pinpoint a time in history which we are confident that the data points align to today’s market data points. In other words; recognising a time in history where our local property values and market conditions are the same (or very similar). This is very difficult indeed, but when applied in tandem with other methods, we have clearer insight into how a campaign is tracking and the likely resultant sale price.
For example, in some of our inner-ring locations in Melbourne, it could be argued that market conditions and recent prices match the Spring market of 2017. In suburbs including Preston, Reservoir, Fitzroy North, Williamstown and Kensington, recent sales results are matching that of comparable properties that sold in the September of our last peak.
In a moving market, analysing sales data can be tricky. But overlaying the known market movement over the past three months, matching up with a comparable market time frame and maintaining an acute awareness of anomaly sales results gives us far greater insight into a likely sales result.
Resetting our price expectations can be painful for some, but it’s essential for buyers in a recovering market to be prepared to segment the sales dates when conducting analysis.