Understanding borrowing capacity

This would be one of the most commonly misunderstood concepts, yet every second headline in the finance pages suggests that the property markets are about to tumble because of a supposed correlation between interest rate rises and property price movement.
The key assumption many are making is that an increase in the cash rate will impact borrowing capacity adversely, and hence restrict all buyers’ budgets.
This is not correct.
It’s important that we understand two key points before we assume that every buyer’s budget will decline, because if we’re making assumptions about the market movement and when to seize an opportunity, we need to be working off the facts.

Not all borrowers stretch to their maximum borrowing capacity. In fact, less than a quarter of borrowers are utilising their maximum borrowing capacity. This chart from 2018 shows the distribution of borrowing capacity used over past years and while it isn’t showing 2022, it’s fair to note that 2018 cash rates were not dissimilar to our current rate; albeit a little bit higher. However, the buffer rate was also higher at this time (circa mid 7%), so borrowers may have felt the desire to push themselves harder knowing that their borrowing capacity was buffered (and limited) to a greater extent than today.
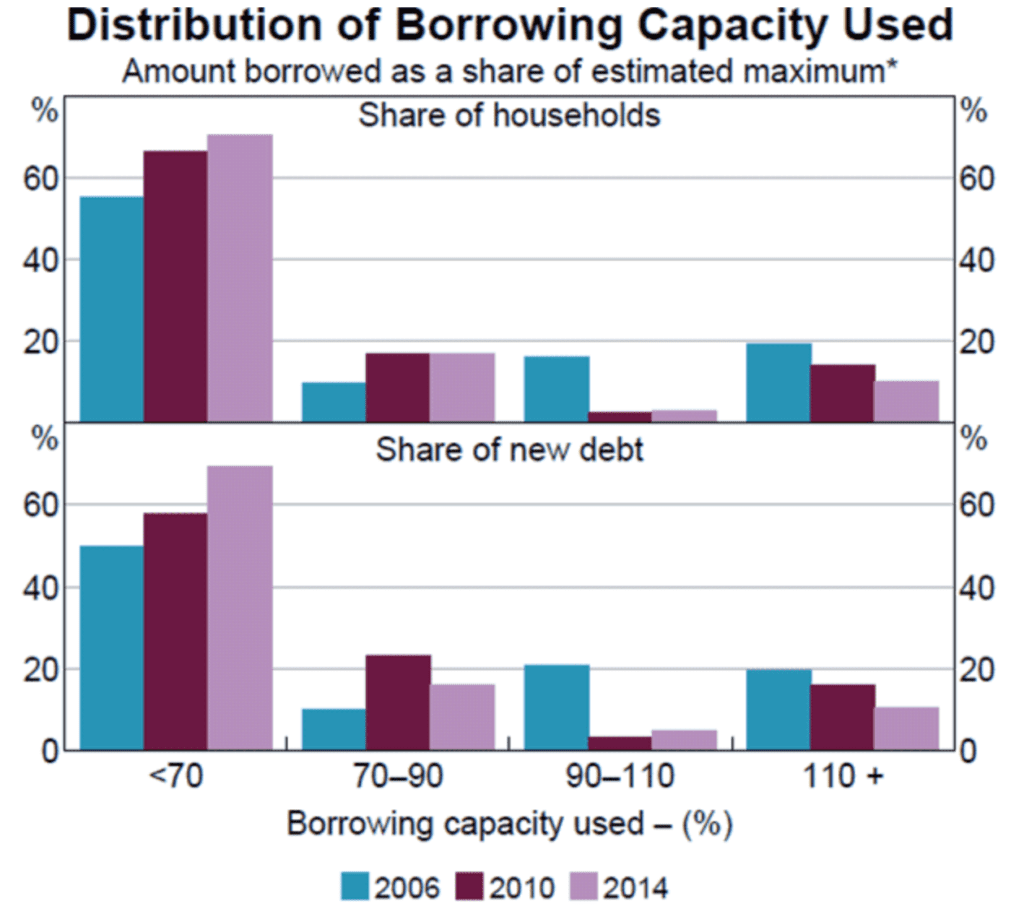
If the majority of borrowers aren’t stretching themselves to the limits of their borrowing capacity, can we really expect a sharp decline in prices due to people’s reduced capacity to compete?
Hardly. The reason why our major markets have marginally declined since the cash rate increases is solely down to sentiment. People are fearful about purchasing just before prices crash.
At this point, any market adjustments are only due to sentiment and fear.
Circling back to borrowing capacity, we have to understand how borrowing capacity is calculated. Before any calculations are made though, borrowers need to have a deposit (or equity) on hand, acceptable credit history, employment and residency status that the bank is prepared to work with, and the property needs to be acceptable to the lender, (including the purchase price matching the lender’s valuation).
It may come as a surprise to know that banks all vary their methodology and metrics for calculating borrowing capacity. Their calculators have different measures for each variable and while one bank may offer a maximum borrowing capacity of $900,000 to a loan applicant, another lender may offer the same applicant in excess of a million dollars. Banks have varying sensitivity to how they calculate income and financial commitments. For example, one bank may accept work bonuses, while another may not. And some may take only a proportion of the bonuses. Rental incomes on existing properties held by the applicant may be scrutinised and only proportionally counted, and so on.
The aspect that all lenders’ borrowing capacity calculators have in common, however is that they take into account all income, all financial commitments and work off a “net income surplus”, (NIS) to base their maximum borrowing capacity calculation upon. Considerations such as age until retirement do come into play for some borrowers but I’ll assume that for the purposes of explaining borrowing capacity, the typical residential loan term is based on a 30 year period. NIS is also known as “net surplus ratio”, (NSR).
“The NIS can also use estimates of living expenses that vary with the household type (e.g. single vs couple, the number of children and post-tax income). Many households find it difficult to estimate their expenditure so lenders compare their stated expenditure with minimum expense benchmarks. The NIS also factors in the broader financial situation of the borrower, including tax liabilities and required repayments on credit cards or other loans.” (Source: RBA)
“The NSR calculation takes net income and subtracts total monthly considered living expenses.
This amount is then divided by current debt and the monthly payment amount of the home loan that the applicant wants to apply for.
(Net income – Total monthly expenses) ÷ New and existing debts
If the ratio is 1:1, the applicant will have exactly enough money to cover the new loan. If the ratio is 1:1.40, it means they can afford 40% of their monthly expenses using their surplus. Each lenders have their own criteria, but generally are all within the same level.” (Source: Tony Xia, The Mortgage Agency)

There are three reasons why the majority of borrowers aren’t stretching themselves to the limits of their borrowing capacity.
The first is that they don’t need to. If a buyer is equity (or savings) backed and the loan required for their property of choice is lesser than their borrowing capacity, they won’t need to stretch to their limits.
The second is that they don’t want to. They may downgrade their budget and their expectations in order to borrow less.
The third, (and most common reason for first home buyers) is because they are capped by their Loan to Value Ratio (LVR) as a direct result of having a limited deposit amount. For example, if a bank offers a maximum LVR of 95% inclusive of stamp duty to a borrower, this requires them to have 5% (plus duties/fees) in savings to complete the purchase.
Even if the first home buyer applicant has a very strong salary, their limited savings will prevent them from being able to borrow the maximum loan amount that they could service. For example, if the borrower’s net surplus ratio, (NSR) is significantly above 1.1, their lender may calculate that they could support a loan of (for example) $1M. But if the first home buyer applicant has $30,000 in savings, they will only be eligible for a loan amount of $600,000 due to their LVR cap. And even at this level, they will be taking on Lender’s Mortgage Insurance in order to do so.*
Their savings are limiting their capacity, not their income.
For many in this position, their situation can be described as cashflow rich/cash poor.
For this category of borrower, a rate hike is not going to hamper their ability to borrow.

*Lender’s Mortgage Insurance (LMI) can be averted for those who are eligible for the various schemes on offer, including the First Home Guarantee (and others).