Why MEDIAN data is not reliable
We often categorise suburb performance by utilising median price movement, but this is such a flawed approach. There are multiple reasons why this measure is unreliable.
Firstly, the median data point is only the mid-point of any given data set. If we apply only median to average values, we risk a skewed bell curve completely. Take this example below. Let’s assume that this graph below represents an outer-ring suburb with a limited range of housing; some older style estates dating back to 1980, and some newly subdivided, smaller sized blocks with much newer houses.
There are plenty of suburbs in Melbourne and our regions that fit this criteria; Keysborough, Nare Warren, Point Cook, Geelong’s Grovedale, Ballarat’s Alfredton and so on.
If a high number of the newer builds with much higher sales prices are sold in a given month, despite a larger array of the older, much cheaper houses dominating the suburb, the median will be higher, as too could be the mode, (the most frequent data point). The first chart below illustrates this.
But does this determine a consistent positive value growth movement for the suburb? Absolutely not. In fact, it captures dwelling value, not land value, and this is a critical consideration when it comes to comparing suburbs for capital growth performance. And as many of my past Sunday blogs highlight, a low land to asset ratio is not a good signal for short term capital growth performance.
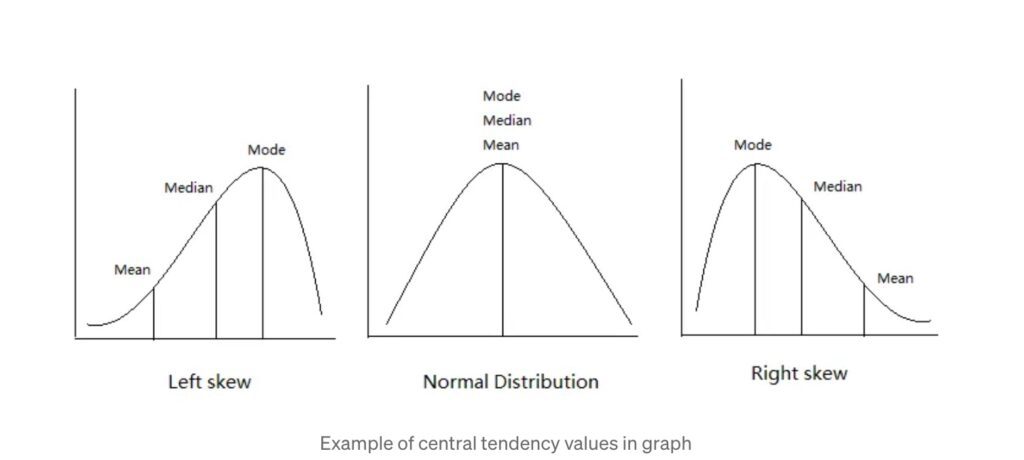
Conversely, if a suburb with a broad range of housing, (such as South Yarra, Armadale, Brunswick or Footscray) experiences a sudden release of high rise, high density small apartments, the right hand graph will apply. Does this mean that Armadale is an underperforming suburb when it’s median property price plummets? No, of course not. It just means that the distribution of 1BR apartments is disproportionate to the actual balance of housing in the suburb for that given month, (or year).
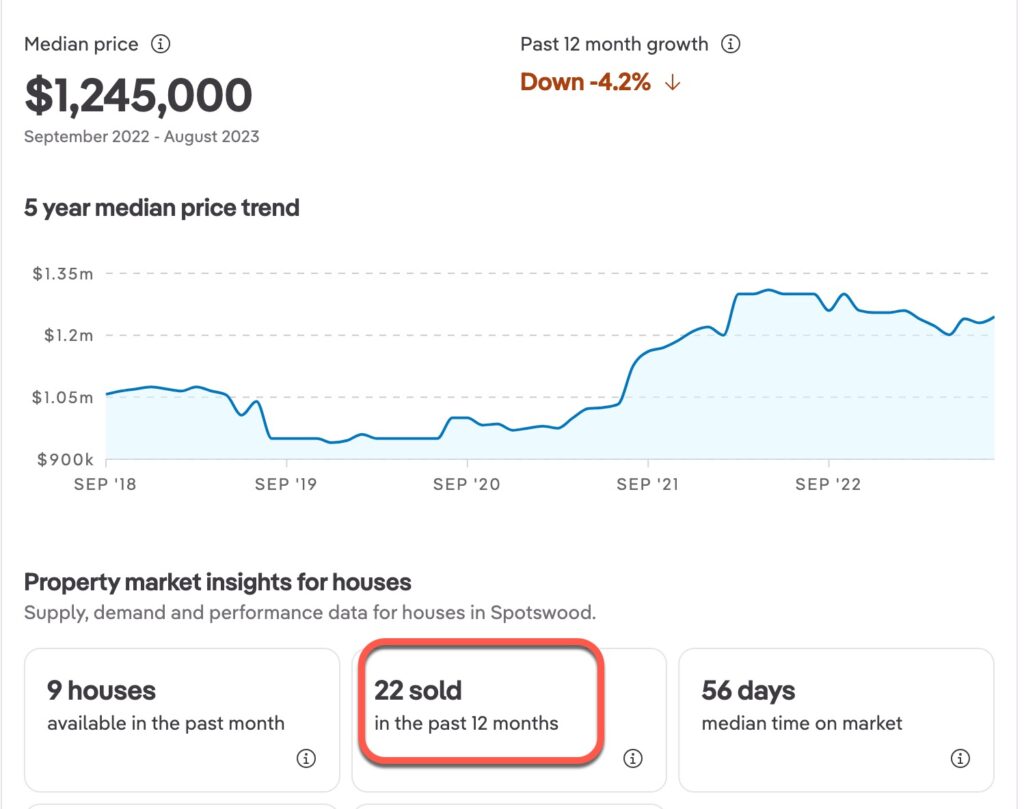
Secondly, if the data set itself is small, what good is a mean value when only a handful of sales have taken place in any given year? This risk is amplified if the suburb in question is home to an eclectic mix of housing. Take Spotswood, for example. With only 22 sales in the suburb in the past twelve months, this figure is inadequate to rely on as a data set for capital growth determination. Spotswood’s data challenge is compounded by the range of housing in the suburb. From factories to units, townhouses to cottages, large family homes to apartments…. it’s a superb illustration of a challenging suburb study.
Thirdly, the next point relates to an even trickier reporting measure. If houses and units are segregated, we tend to find that unit data is very blurred. ‘Units’ sum up a vast array of dwelling types. Anything that has been subdivided essentially is captured by this categorisation. How do we compare the performance of these two dwelling types though? With ‘unit’ measures, it’s almost impossible and common sense needs to be applied. It is fair to say that the bespoke townhouse on the left would perform far more like a house data set, while the 1BR high rise would likely underperform the broad unit data set.

In addition, many data houses and portals work off short-term price movement; a ridiculous way to look at a suburb’s performance. When considering the investment grade attributes of a suburb, a much longer timeline must be taken into account. Typically I prefer to work off ten and twenty year data sets, unless recent gentrification has impacted an area.
Finally, government incentives, seasonality and other factors beyond dwelling releases can skew the findings. If we cast our minds back to 2021, when the Andrews Government introduced a short term incentive for any residential purchasers to buy in the sub-$1M market, we saw a disproportionate amount of sales in the high-nines.
Data is knowledge, and knowledge is power, so they say.
But just make sure you’re relying on the right balance, and the right data.