What are ‘early market indicators’?

In this current climate, we have experienced an adjustment to the way in which we use data to measure the state of our property market. Traditionally, we have always been able to rely on a combination of;
- auction clearance rate,
- days on market,
- median house price movement, and
- transaction numbers.
With auctions only just resuming, we still have a hazy separation between online auctions and public auctions due to COVID-19 auction attendee restrictions, and the integrity of the reported auction results is equally as difficult to rely upon because of the changing nature of property campaigns.
Some scheduled auctions are being converted to private sales, and some competitive negotiations are being wrapped up via auction-style methods online.
It is tough to distill the auction data at this point.
To compound the lack of clarity with our reporting mechanisms, our lower stock volumes are proving to be a challenge for buyers and agents alike.
Our current market can broadly be described as fearful and cautious, yet we do indeed have a number of buyers who have overcome their immediate fears and have resurfaced since April. Considering we’re still in a market that is experiencing COVID-19 restrictions, it may surprise some that our prices have held firm.
The key reason for this is stock shortage.
Vendors have decided to sit tight, (and why wouldn’t they, when media headlines spell price falls?) Our buyer:seller ratio has markedly increased to a higher level than our prior year’s lofty ratio.
The hallmarks of a high buyer:seller ratio is increased buyer competition.
We have consistently experienced strong buyer competition throughout late April and all of May. Auction bidder numbers have been double-digit in the inner and middle ring locations, and prices have either held firm, (against expectation) or exceeded expectation.
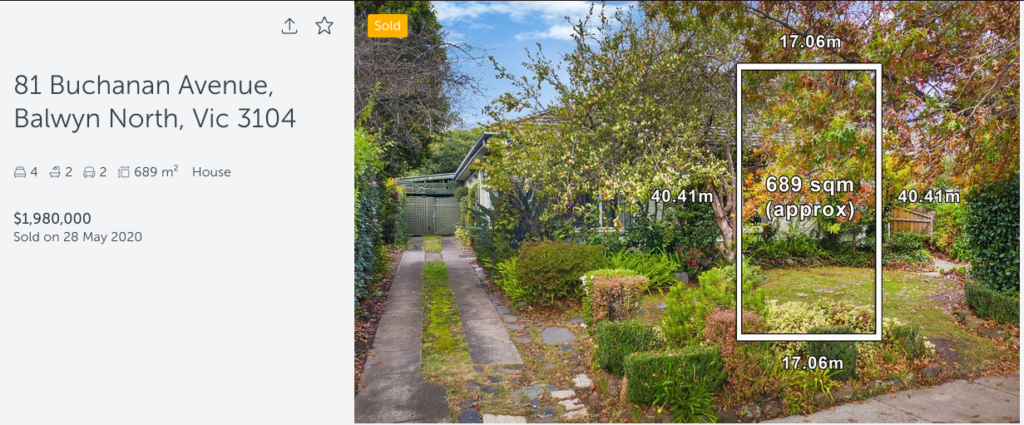
This property at 81 Buchanan Ave in Balwyn North sold $290,000 above reserve on Thursday night. Bidder numbers were so inflated that the in-room auction was altered to a zoom auction in an effort to accommodate the sheer number of participants.
Multiple bidders fought it out last Saturday at our first public outdoor auction since lockdown in Kew. The final sale price of $1,695,500 was a stark contrast to the $1.1-$1.2M auction quote, and an illustration of tough buyer competition.
For those of us at the coalface, we’re waiting for some relief for buyers. This relief comes in the shape of increased listing numbers, and the only insight we have into this is what we refer to as ‘Early Market Indicators’.
Core Logic has released a recent report titled “Clarity in uncertain times” in an effort to share some visibility, and offer consumers and industry professionals some insight into current data, and how this data contrasts to 2019.
There are several early market indicators that can prepare us for the coming weeks at the coalface. The first measure is “Pre-Listing activity”. This is identified by the data house from the creation of real estate agent CMA, (Comparative Market Analysis) generation. While CMA generation is not a pre-requisite for listing and appraisal activity, it is a good market indicator of the increasing or decreasing numbers of agent appraisals being undertaken.
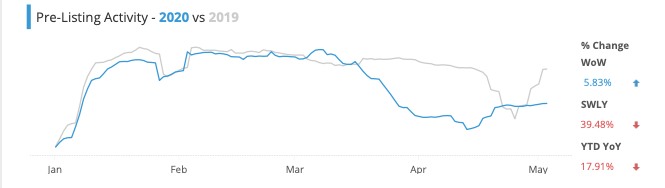
This chart clearly shows a dramatic slowdown during the rising and peak COVID-19 case numbers in Australia. It perfectly correlates with the impact of the pandemic on our industry, from restrictions to lockdown. Little wonder that agent appraisal activity stalled quickly and matched January figures; a time when most agents are laying on a beach enjoying some downtime. Interestingly the same measure for 2019 shows a marked decrease in appraisal activity leading up to the Federal Election. The election marked the end of our last downturn, and that particular recovery is fairly described as V shaped, as our sentiment bounced back following that surprise election result.
In contrast to May 2019, May 2020’s post lockdown appraisal numbers do show an increase in activity, but a slow and cautious one is more evident.
Newly advertised property is the second early market indicator. We saw a dramatic reduction in both rental and sales advertising in April and this can largely be attributed to the social restrictions.
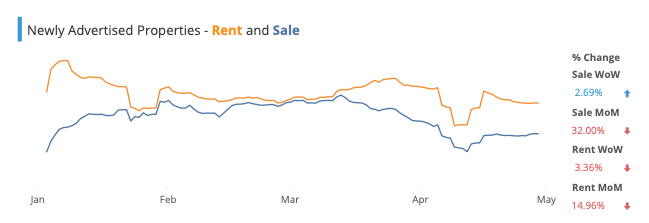
Why pay for a search engine ad if, legally you aren’t able to bring large numbers through the property?
Vendors and landlords who were still actively trying to sell or lease their properties reverted to off-market and word of mouth stock lists. Agents made more phone calls, agencies worked their databases, and the search engines had lower advertising volumes. Interestingly, with the recommencement of public auctions, the advertising bounce-back is visible, but not increasing through May.
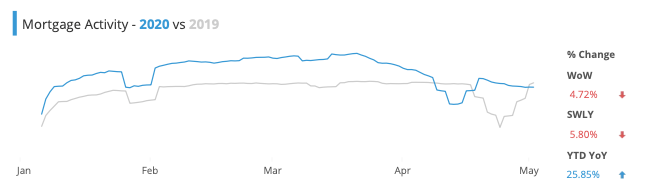
Mortgage activity is the third early market indicator. This chart below compares 2019 to 2020 and shows two slowdowns only a month apart from each other in the consecutive years. Last year’s downturn in mortgage activity was triggered, again by fears about the outcome of the Federal election (specifically the change in tax legislation around negative gearing). It is important to note that a large portion of April 2020’s mortgage activity was in fact refinance, (as opposed to purchase or construction). Compared to the same time in 2019, refinance activity was up, while purchase activity was 22% down.
So what can we glean from this data right now?
The pre-listing activity suggests that vendors who were planning to sell in 2020 before COVID-19 struck our shores are not aware of the true market conditions at the coal face right now. They are still holding back, sitting tight.
Until we see increased listing activity, we can anticipate strong buyer competition continuing to bite.