Where has our spring market gone?

This year’s spring in Melbourne is distinctly different to past years’. Our listing and sales volumes are down significantly and our auction clearance rates are no longer signalling seller’s market conditions.
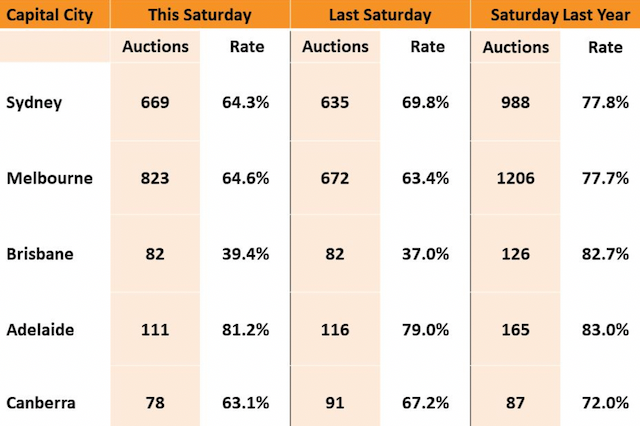
Last year’s heady clearance rates coincided with large stock volumes. Melbourne’s eternal lockdown was finally over and vendors were keen to sell prior to Christmas. By anyone’s measure, 1206 auctions represented a significant figure. Buyer demand was palpable, and even in the haze of a busy super-Saturday, our clearance rate still remained strong at 77%.
While our clearance rates aren’t dismal now, it’s fair to say that they are only holding up above 60% because our stock levels are so low. Typically November boasts enormous auction Saturdays, with agents kicking off at 9.30am and finishing their final auctions after 4pm, and it’s this time of year where we see a sprinkling of mid-week twilight auction activity.
But that’s not happening this year.
We find ourselves in an awkward situation, where ‘chicken and egg’ best describes vendor motivation. Vendors can sense the low stock volumes and they are saying to themselves, “I don’t want to sell if I can’t be confident I can buy”. Rhetoric around inflation and interest rate movement is compounding the problem because Melburnians know all too well how quickly things can turn, and how rapidly prices can rise once the bell has rung. Prospective vendors aren’t all that keen to sell now and buy indefinitely if there is a chance that the market could race off on them.
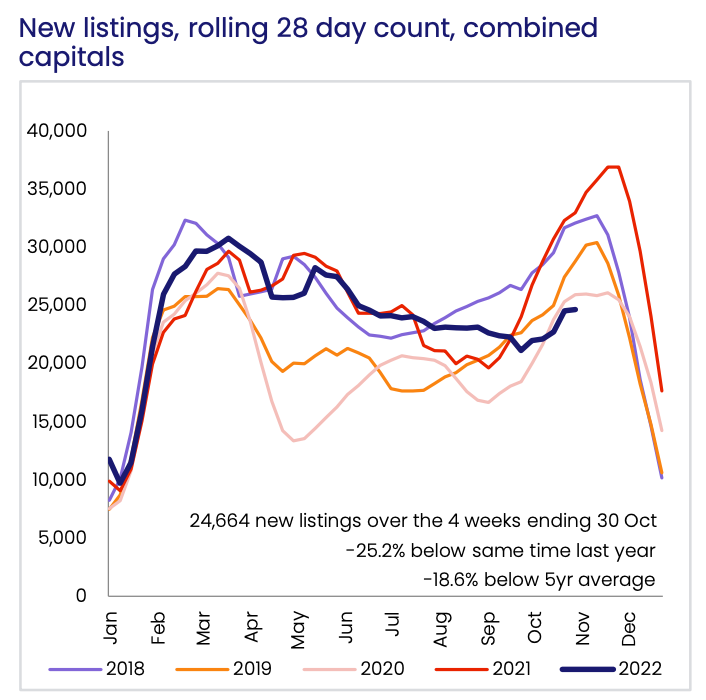
Our 2022 spring market volumes across all capital cities now sit at a five year low for both new listing activity and all listings. This rolling 28 count chart below shows merely a blip in uplift for our spring market, in fact our winter volumes were actually higher.
This is a first in decades.
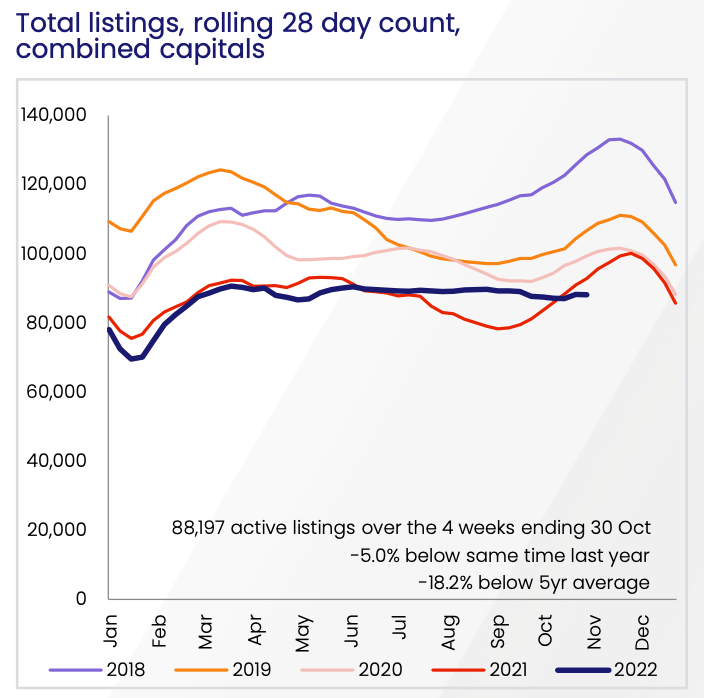
The compelling chart, however is this all listings rolling average for our combined capitals. This stock includes old listings (defined by a 180 days+), current listings, distressed listings, and new listings. Every year, (with the exception of this unusual year) shows a spring uplift.
This particular time though, it’s a flatline.
The direct correlation to listing volumes is sales volumes. Our sales are down across the board. Aside from the economic pressure this puts on our supply and demand ratio, it is also representative of financial pain for agents, agencies, state governments (in the form of lower duties and taxes), banks, conveyancers, search engines, and all other industries that are intertwined with the property industry, such as valuers, removalists, furniture staging companies, printing houses, and the like.

Could it be that COVID reshuffled so many households and dwellings, we’ve pulled sales forward and now it’s a natural lull? Or am I right to draw a likely conclusion of ‘chicken and egg’ for vendors? Only time will tell, but one thing is for sure.
This spring market is missing it’s spring.