Why are prices rising when interest rates are higher?

So many prospective buyers have been waiting it out for the fixed rate cliff to create price fall opportunities for them. Plenty of others have simply subscribed to the notion that that the increased cost of borrowed money will have a direct correlation with price falls.
Surprisingly for them all, our national median house prices have continued to move upwards.
There are reasons for the price growth we’ve seen many of our cities.
In this Sunday Blog, I’ll address these reasons and I’ll also share why the fixed rate cliff is not coming.
The first growth driver relates to savings. More households have deposits on hand and an increased level of confidence about their ability to manage the increased mortgage payments.
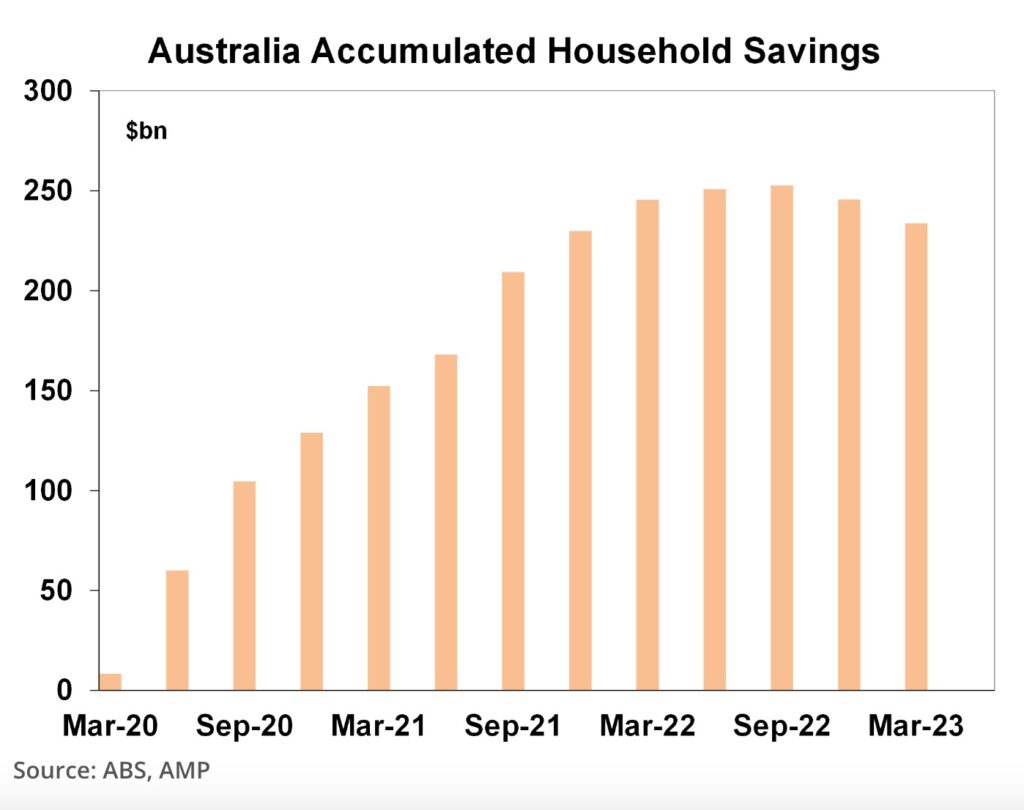
While the cost of mortgages has increased dramatically for those on variable rates, our nation was forced into household saving during COVID lockdowns. The chart below shows this dramatic increase in savings since COVID hit our shores and it is evident that only a small portion of savings have been eroded since interest rate increases were applied in May 2022.
“Since this peak, consumers have drawn down just 7% of their excess savings (up to March 2023). This means that consumers still have a relatively high degree of excess savings and at the current slow run-down of savings it would imply that consumers could still have another 2-3 years of excess savings to work through.” (AMP Econosights)
While it could be argued that many households’ savings buffers will be depleted over the next two years, people don’t generally sit back and wait for things to reach crisis tipping-point. We have already witnessed the liquidation of assets and some down-sizing moves that the increased cost of living initiated.
Every borrower who took advantage of the emergency-level rates during the pandemic was fully aware of the fact that their interest rates were at record low.
Not only did most borrowers provision for this, but their borrowing was buffered by the bank. Australian lenders apply a three percent buffer rate to all borrowing capacity calculations. This means that every borrower has been assessed on their ability to repay a loan that is 3% higher than actual. While there are borrowers who were assessed with a buffer rate that has now been slightly eclipsed, it is a small proportion of total borrowers.
And let’s not forget that of all households, roughly one third rent. One third own their home outright. And the remaining third have a mortgage.
The next growth driver relates to supply and demand. Our listing volumes have been particularly low since COVID, and in fact this spring season is the first time nationally during this period that our stock volume has risen to the five year historical average.
This Core Logic chart below shows that our new listings volumes are up. However, the subsequent chart shows that our buyer demand is still soaking up our total listings.
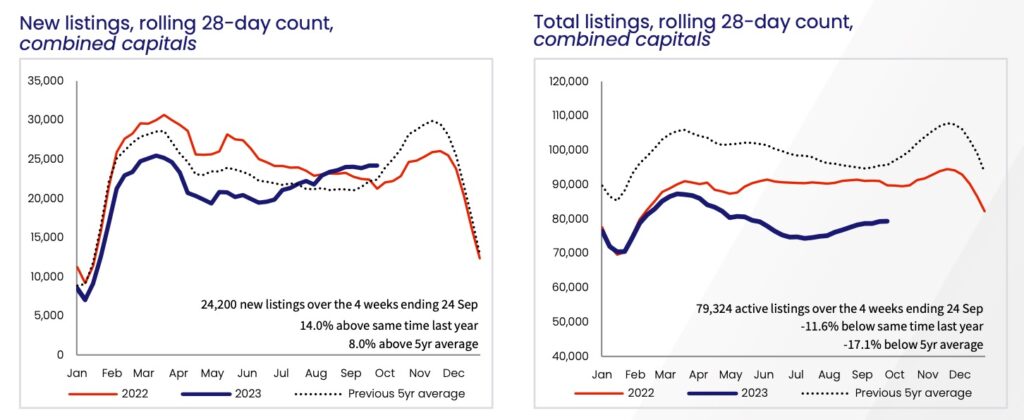
Buyer demand is palpable, and even for this current weekend of high sales activity (particularly in Sydney and Melbourne), our auction clearance rates demonstrate the strength of the demand.
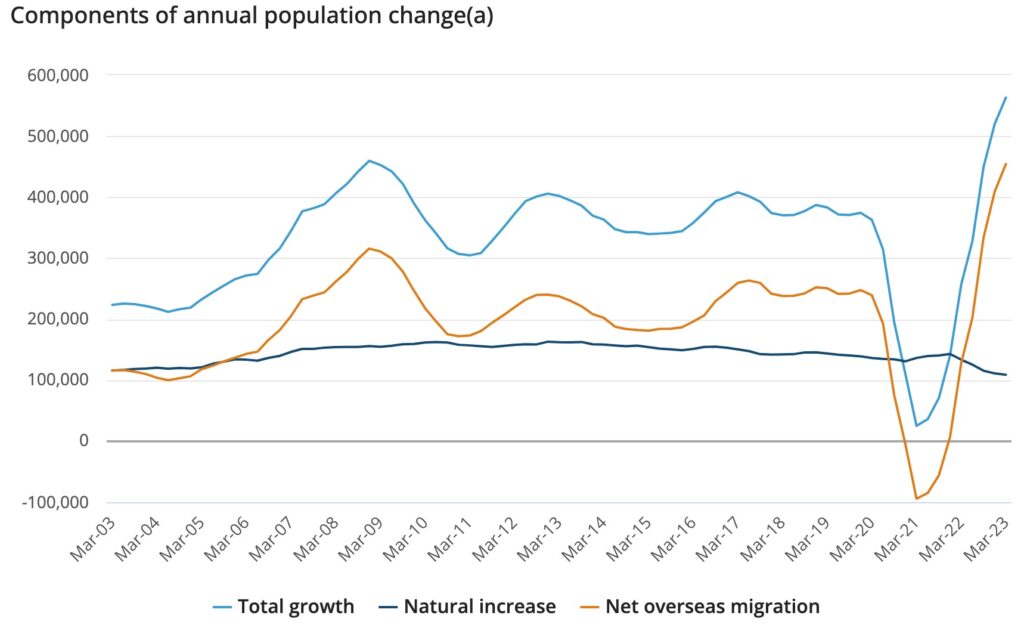
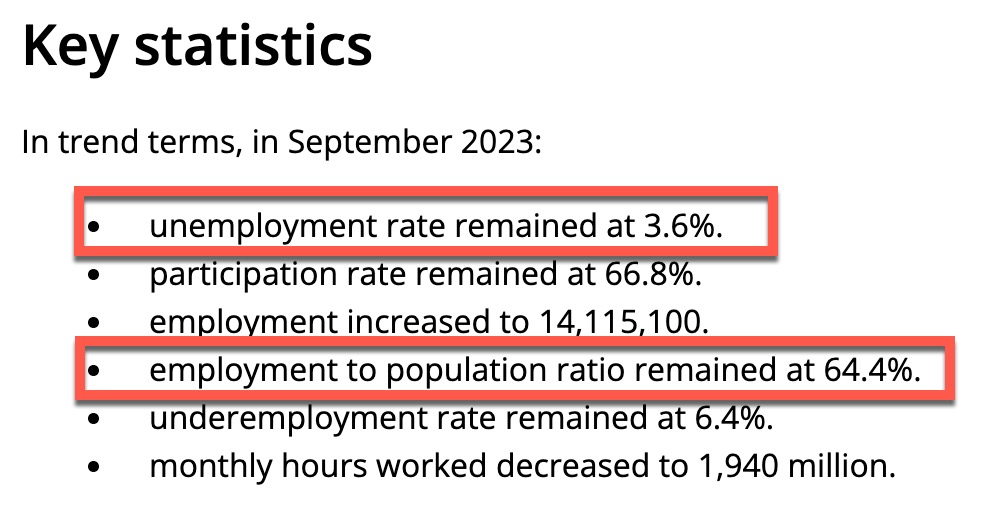
The demand is due to a combination of factors; new arrivals/skilled migrants, wages growth, low unemployment and increased consumer confidence in relation to stabilised interest rates.
The Albanese government has applied an increase to the numbers of skilled migrants and new arrivals (particularly students). “In the year ending 31 March 2023, Australia’s population grew by 563,200 people (2.2%).” (ABS)
We’ve seen wages growth as follows:
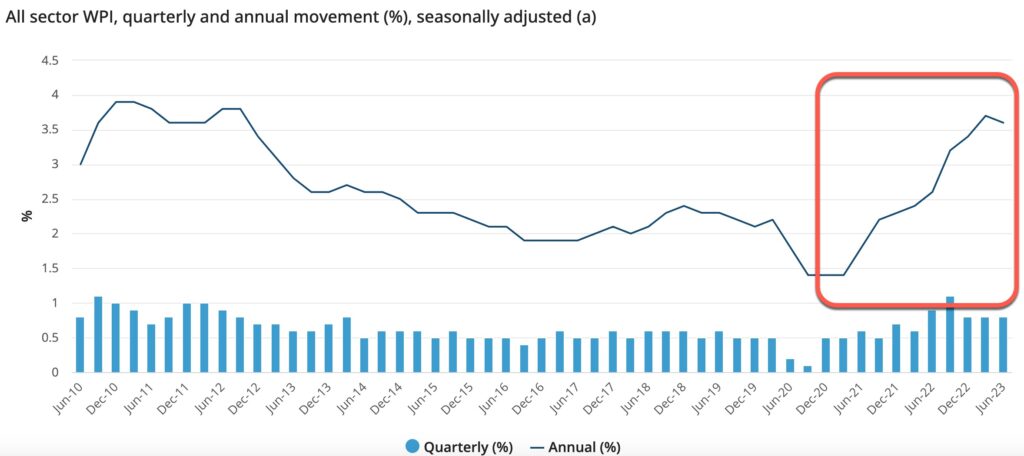
Unemployment is low and borrowers know this. Their sense of employment confidence is reasonably high.
The consensus is broadly indicating that consumers are not anticipating an imminent rate increase. While we have some difficult events around the glob currently, our short term market expectations of interest rate movement is indicated in this ABS Rate Tracker.
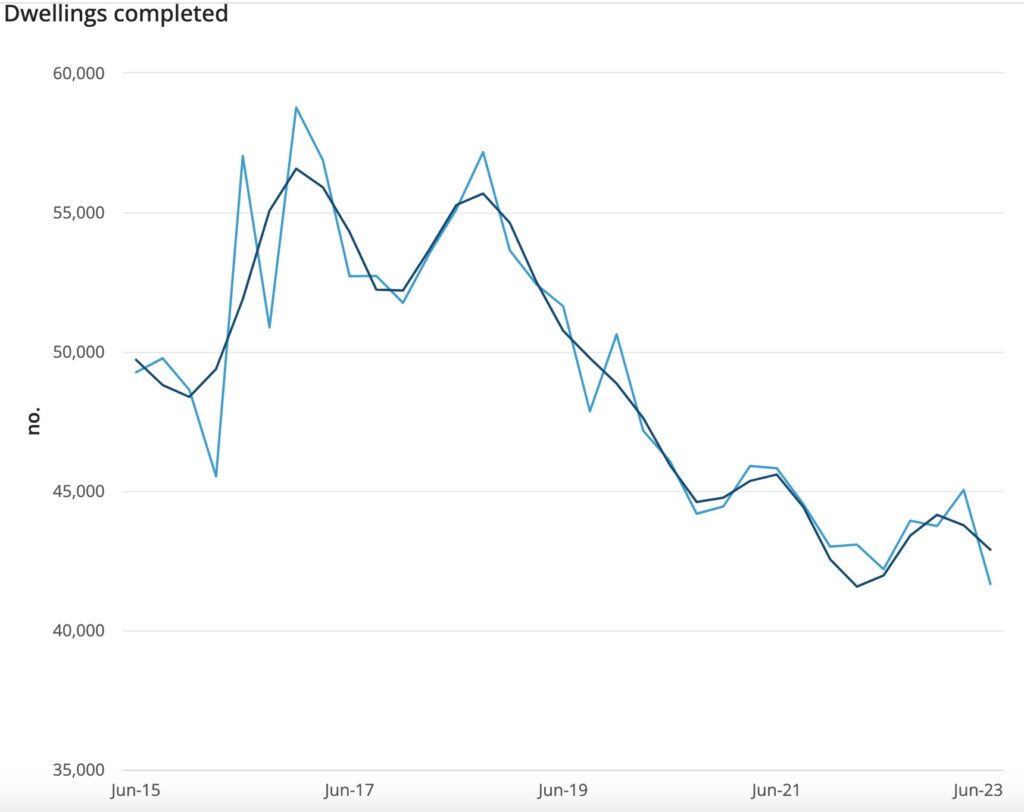
These drivers, collectively have put pressure on housing. This pressure has been amplified by the dramatic slow down in building completions. With insolvencies, hefty increased materials costs and a labour shortage, this challenge is not about to abate any time soon.
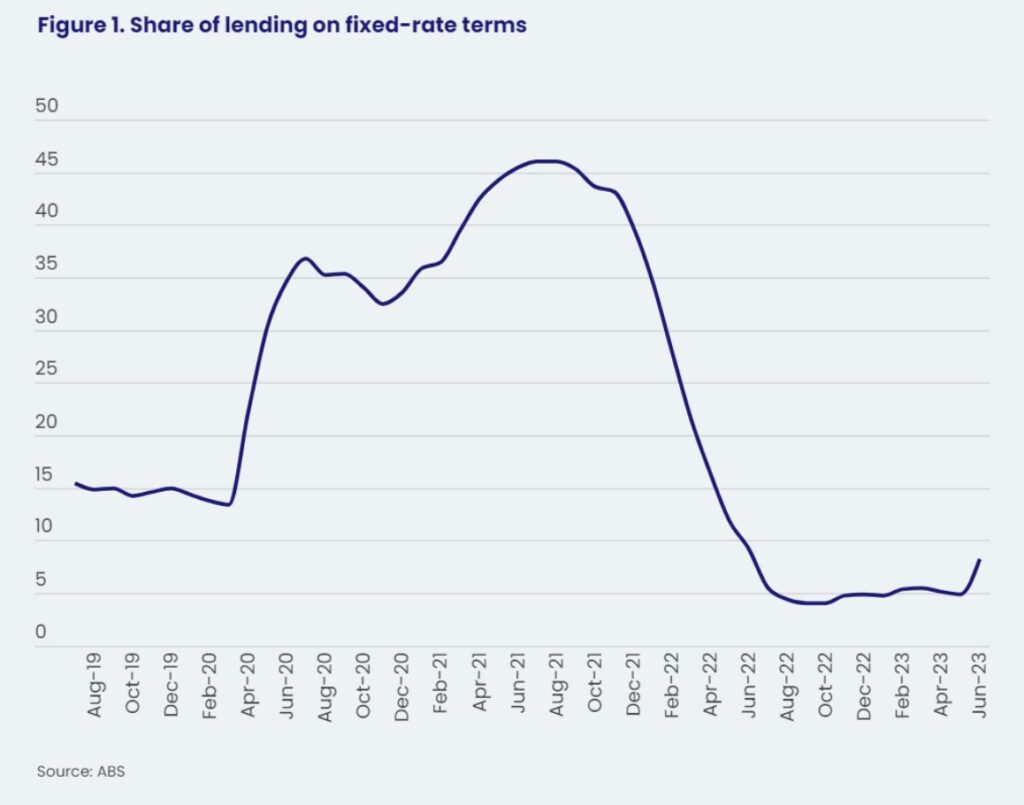
So, back to the fixed rate cliff….
“We are now more than half way through the 350 billion dollar wave of fixed rate loans moving to variable loans. Even during the spike of fixed rate mortgages, the majority of households were on variable rates and the VAST majority from Mid 2022 were already electing for variable rates.” (Mike Mortlock on this podcast episode).
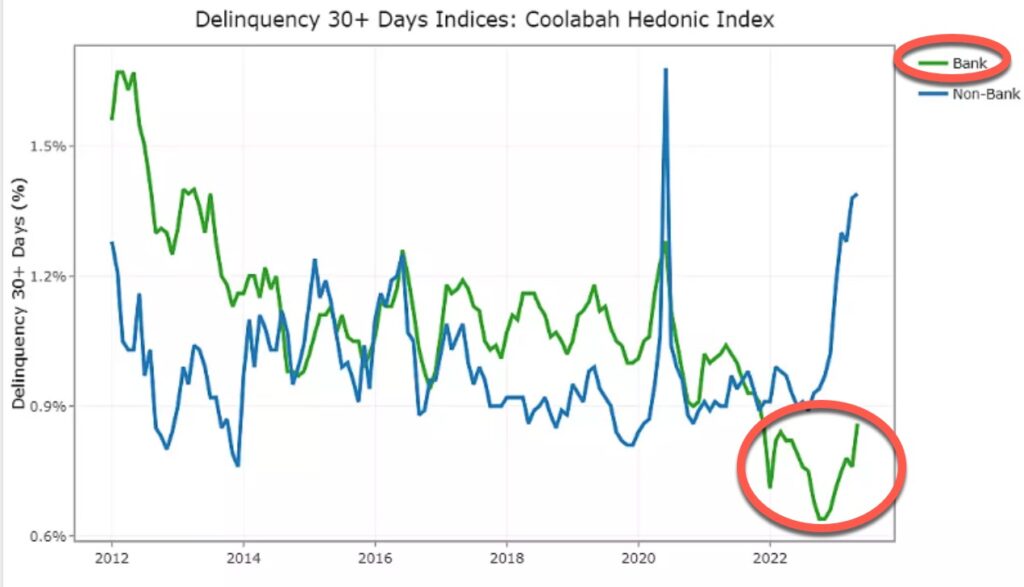
While delinquency rates have ticked up this year, they are nowhere near recent historical peak levels.
It’s important to check the source of reported data and hold it clearly in perspective. Those who are talking about a fixed rate cliff stimulating price falls and delivering discount opportunities may indeed be the people who are hoping for the opportunity. But I believe the data suggests otherwise.