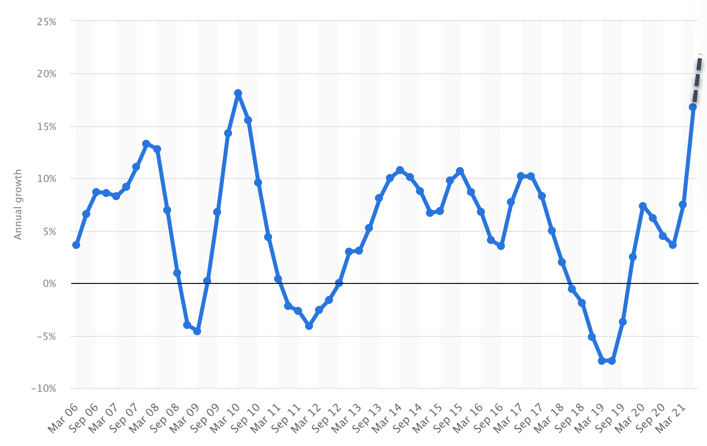
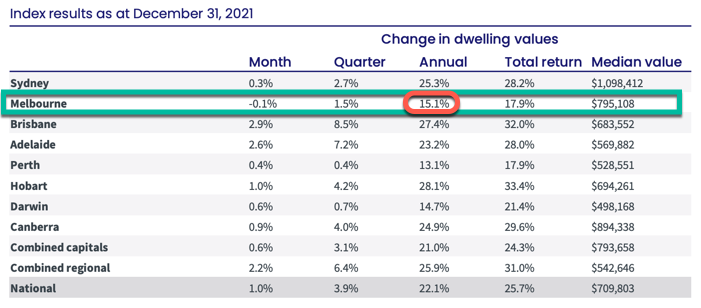
The end of 2021 reports are out, and as predicted by more than a few, and both Hobart and Brisbane’s colossal house price growth pipped other states’. Our national capital growth rate of 22.1% for the past 12 months has been the greatest since 2003.
The slowdown in the growth rate in the final month of the year was totally unsurprising, particularly given the fact that Melbourne exhibited a 0.1% drop in value based on the sheer volume of very late campaign starts that were essentially pushed to the back of the 2021 calendar following our world-record lockdowns.
I challenge those who believe that Melbourne’s property growth outlook is limited, however it would be naive to assume that the extended lockdowns haven’t had a detrimental impact on many jobs. Our new challenge is labour shortage, particularly as the Omicron variant takes its grip and continues to plague our efforts at economic recovery. Sadly, our regions face the same struggle; exacerbated by a strong increase in summer holidayer’s who are still avoiding border crossing.
Melbourne’s headwinds may well stay in place through 2022, but it is only fair to say that despite everything this city has been through, a net annual growth of 15.1% is nothing short of miraculous.
Tracking a city’s performance on a monthly basis is like checking body weight change daily. One month is only one data point, and it is very hard to draw conclusions about the state of any particular market when considering a short term movement. Melbourne is a perfect case in point for the month of December. While Canberra and Sydney also experienced lockdowns and schedule delays to sales campaigns, Melbourne’s delays were amplified for three reasons;
- Unlike Sydney, Melbourne’s harsh and long 2021 lockdown completely precluded anyone from inspecting a property.
- Although Canberran’s too were shut out of inspecting altogether, unlike Canberra Melbourne’s lockdown spanned for much longer. Our real estate trading conditions were hampered for months on end.
- Melbourne’s dominant selling period, (and selling style) is auction activity in Spring.
All of a sudden in October, our agents and vendors found themselves scrambling to schedule in campaigns, opens and auctions. Faced with limited diary space, horrendous one-on-one, (privately booked) inspection requirements and only ten weeks remaining to facilitate a record number of delayed campaigns, our regime deviated somewhat from past years. We had intensified volumes, short days on market and agents who were only just able to cope with the demands of the conditions.
This chart below shows the sheer number of sales during the final weeks of the year. Despite being a national chart, there is no doubt that Melbourne and Sydney’s surge in volumes accounts for a reasonable chunk of it.
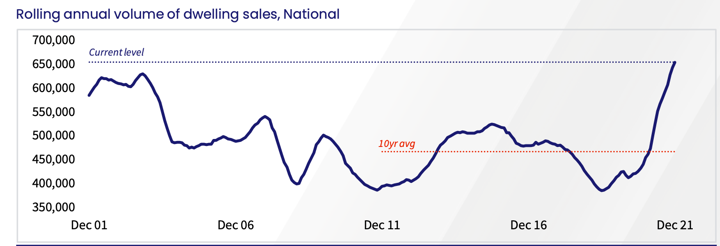
Even then, with a record number of properties on the market during a time when our freedoms were finally easing again, Melbourne buyer demand still kept up with the surge of activity.
By anyone’s measure this illustrates strong buyer demand.
Melbourne’s headwinds as a result of extended lockdowns are interesting. Economically, our recovery still has some way to go. The knock-on effects of lockdowns saw large numbers of people leaving our city and our labour shortage, negative sentiment associated with border controls, university admission reduction, and job losses as a result of the lockdowns have some of our forecasters tipping a stabilisation in population count through 2022 before growth recommences in 2023.
“The pandemic and localised lockdowns have had a significant impact on net interstate migration. Victoria experienced negative net interstate migration in 2020-21 for the first time since 2008. This was driven by a large drop in arrivals to Victoria during the second Melbourne lockdown and a large outflow of people from Victoria after the lockdown ended in November 2020. Victoria is forecast to experience similar negative net interstate migration in 2021-22 due to the extended Delta lockdowns. Net overseas migration is forecast to be negative in 2020-21 and 2021-22, driven by the departure of international students and temporary migrants. However, this trend is expected to reverse from 2022-23 onwards, consistent with the national trend.”
(Source: Australian Government Centre for Population, December 2021 Population Statement)
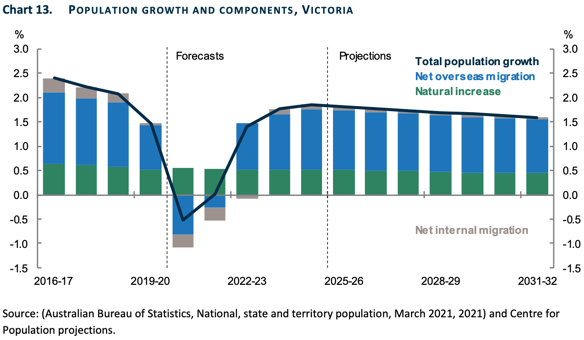
According to the Australian Government’s Population Statement, “The population of Victoria is projected to increase from 6.7 million in 2020-21 to 7.9 million in 2031-32. Victoria experienced the largest impact on population growth from the COVID-19 pandemic. Prior to the pandemic, Victoria was the fastest growing state, consistently recording growth above 2 per cent per year. In 2020-21, Victoria is forecast to record negative growth of -0.5 per cent, due to negative net overseas migration and negative net interstate migration (Chart 13). As travel restrictions ease and the economy recovers, Victoria’s population growth rate is projected to recover to 0 per cent in 2021-22 and then to 1.9 per cent by 2024-25, making it once again the fastest growing state.”
We do have to ask the question, “If, during these horrible headwinds, and in the face of net-negative population growth, Melbourne still managed to deliver 15.1% annual growth, what is in store for Melbourne when population is once-again, back on the rise?”
“Melbourne is projected to be the fastest growing capital city from 2023-24 onwards, and to overtake Sydney as the nation’s largest city in 2029-30 with just over 5.9 million people in that year. Melbourne’s growth over the projection period is driven by slightly stronger net overseas migration and stronger net internal migration than Sydney.”
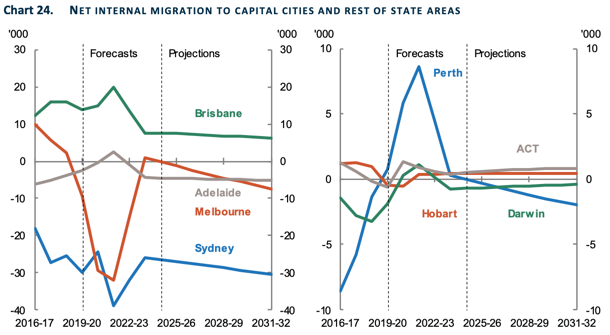
Interestingly, the report also documents Melburnian movement over the past five years and this chart below highlights the negative impact of our 2020 lockdowns. Extenuated conditions through 2021 illustrate even stronger internal net migration.
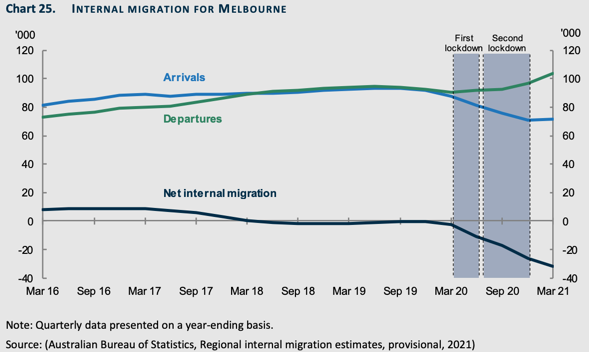
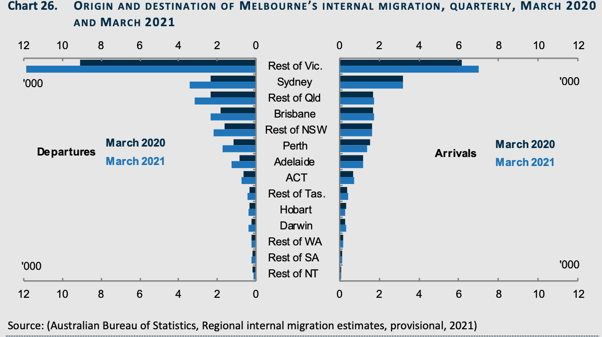
What is particularly interesting is the answer to the question: Where did they go?
“Residents departing from Melbourne in the year ending March 2021 were most likely to settle in the rest of Victoria (44,100 people), but there were also large flows to Queensland (20,300 people) and New South Wales (19,900 people).” (Source: Australian Government Centre for Population, December 2021 Population Statement)
Herein lies some answers to our impressive regional performance during (arguably) our city’s most difficult period in decades. People did escape to the regions, and as we can all accept, a decline of 50,000 people in a city of five million people represents a 1% change, however a population increase of this magnitude shared amongst regional cities is a much greater population shock. Relative to available housing and stock for sale, it’s little wonder that our Victorian regions had a burst of activity during the pandemic and outperformed several other capital cities.
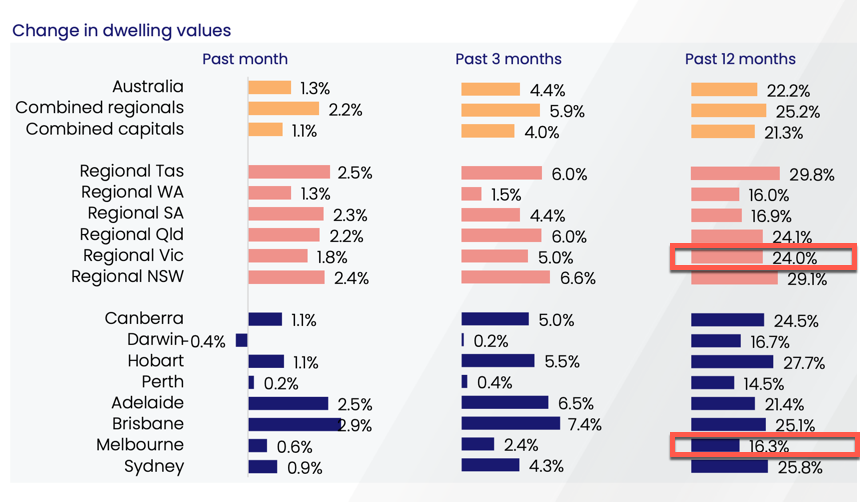
Melbourne’s regions boasted a 24% annual increase in capital growth through 2021.
Many could ask the question, “Ahh, but is this growth merely a knee-jerk reaction to COVID lockdowns?”, and my answer is no. While lockdowns would have no doubt fuelled some of this, our regions have other growth drivers also.
The first growth driver for our regional markets is that of continued internal migration in response to housing affordability and the bolstering of our large regions. We saw it in NSW and we’re seeing it in Victoria. Many singles, couples, families and retirees are seeking a place to call home outside of the capital.
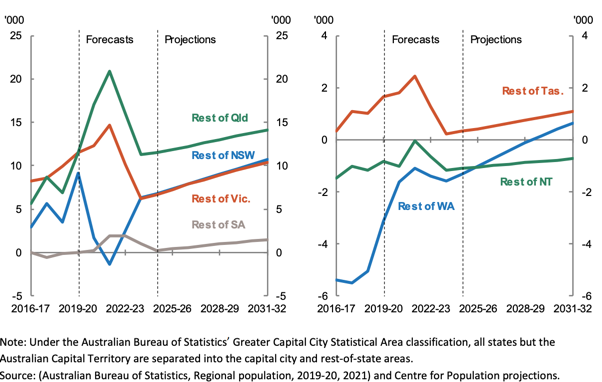
Job creation has been a state government agenda item for decades and we can witness examples of this throughout many of our major regions. These two charts below show forecasted projections for net internal migration beyond COVID lockdown impacts. Interestingly, beyond 2025 we can see that forecasts reflect heightened migration away from Melbourne, Sydney, and Perth, coinciding with increased net internal migration to every state and territory’s regions.
In addition to this trend, our net overseas migration forecasting suggests a particularly strong driver to housing price growth. The period 2020 to 2022 has illustrated the dependence our nation has placed on migration over the decades and the impact of limited population growth.
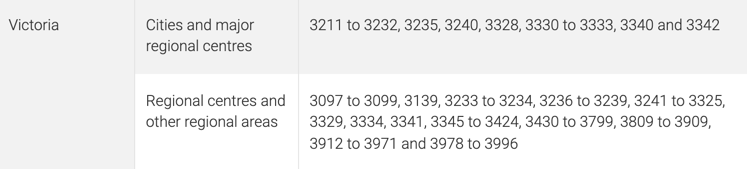
The second regional growth driver relates to international migration. Overseas migrants are not only making their way to our capital cities. Opportunity can be found in many regional cities also. This list of suburbs below was extracted from a national list, supporting visa applications for skilled migrants in many regional cities and areas outside of our capital city. We can anticipate continued regional population growth as a result of both internal and overseas migration.
“The 2021 Statement analyses the extraordinary impact the COVID-19 pandemic continues to have on Australia’s population. Australia’s population has already recorded the slowest growth in over 100 years and growth is forecast to remain low at 0.3 per cent in 2021-22. This largely reflects the restrictions placed on international borders over this period. Overseas migration, which in recent years has been the main source of Australia’s population growth, is forecast to be a net outflow for the first time since just after World War II.” – The Hon Michael Sukkar, MP
However, a glance at Melbourne’s forecast population growth over the coming decade suggests that the negative impacts of COVID lockdowns won’t plague Melbourne for ever.
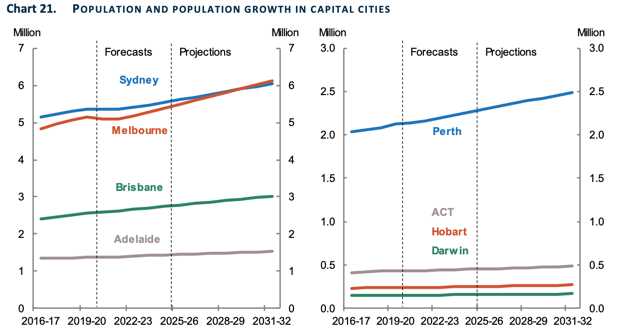
Population growth is by no means the sole indicator of economic prosperity and housing capital growth, but these projections indicate that there is a lot more in store for Melbourne.
For this troubled city to record double digit capital growth during a year of world-record lockdowns, net negative internal migration, job losses and pandemic fear, we do have to acknowledge Melbourne’s resilience and more so, the power of record-low interest rates.
REGISTER TO OUR NEWSLETTER
INFORMATION
CONTACT US
1A/58 ANDERSON STREET,
YARRAVILLE VIC 3013
0422 638 362
03 7000 6026
CATE@CATEBAKOS.COM.AU