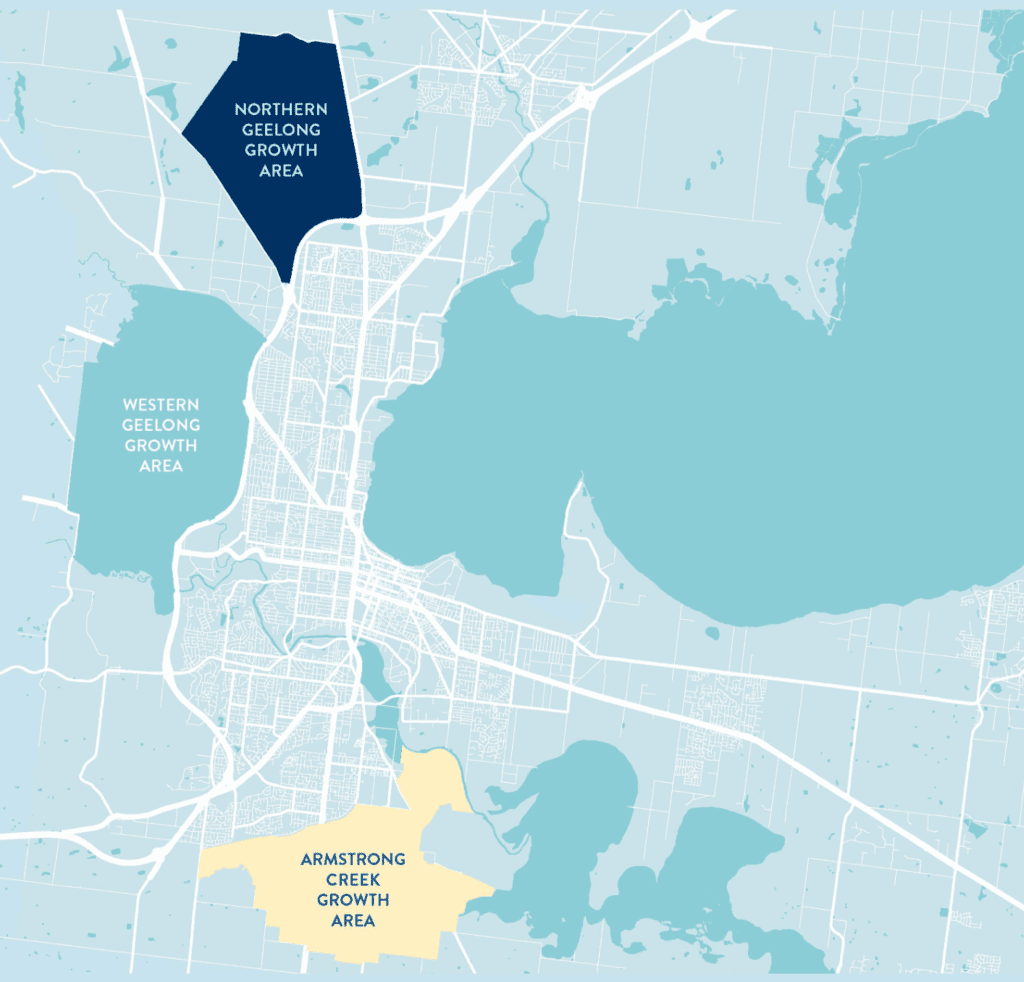
Geelong’s historical growth, combined with it’s current growth drivers suggest this city is one to watch

Geelong’s growth has been documented and discussed in the media throughout the years. This city by the bay has been featured countless times for its capital growth surges, particularly during COVID. The reality is that the inner suburbs of Geelong have done better than the occasional surge. Locations such as Newtown, Geelong West, Rippleside, South Geelong, Belmont, Drumcondra, Manifold Heights and East Geelong have demonstrated more consistent strength than most would believe.
The post COVID recovery for Geelong has been slow, and like Melbourne, Ballarat, Bendigo and plenty of other Victorian cities, the correction was notable.
This isn’t the first time Geelong has been impacted by a downturn, in fact the Pyramid collapse, and the closure of the Ford plant were tough hurdles for Victoria’s second biggest city. Yet Geelong demonstrated a resilience each time, and the most recent downturn following the interest rate hikes in May 2022 is now behind us. Anecdotally, agents are reporting a strong uptick in buyer interest and prices are now suggesting Geelong is well into another recovery.
A late 2024 AFR interview with Propertyology’s head, Simon Pressley circled in on the depths of the recent downturn and the impact of reduced buyer interest during this time.
“From 2009 onwards, the great regional city of Geelong has consistently been Victoria’s strongest ‘magnet’ for internal migration,” Mr Pressley said.
“But, like everywhere else in the state of Victoria, its property market is currently ‘soft’.
“There’s an elevated volume of housing stock on the market and buyer confidence has waned. This is best illustrated by the 20 per cent reduction in Geelong real estate transaction volumes, from 6615 in 2021 to 5340 last year.
“Vendors will need to continue to taper their expectations in 2025 (and beyond).”
Vendors did indeed taper their expectations, and some well-timed purchases will no doubt reward the 2023 and 2024 buyers. Now that the local market has responded favourably to the interest rate cuts, first homebuyers, and upgraders are demonstrating strength. The return of interstate investors to the Victorian market is not just limited to Melbourne. Geelong agents are reporting higher numbers of investors also. However, the larger drawcard that most don’t talk about is interstate and intrastrate migration.
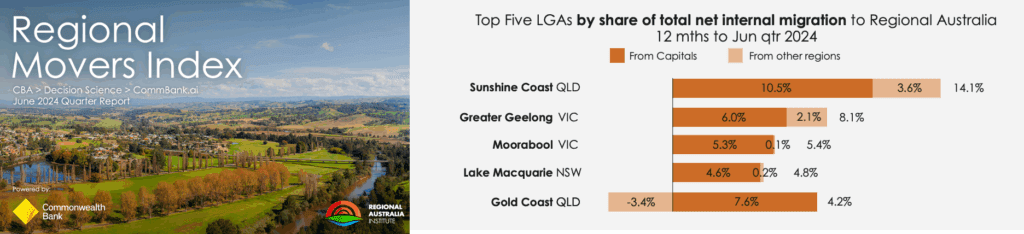
The Regional Movers Index presents fresh analysis of movements between Australia’s regions and capital cities. The most recent report showcases Greater Geelong as the second largest LGA by share of total net internal migration in Australia.
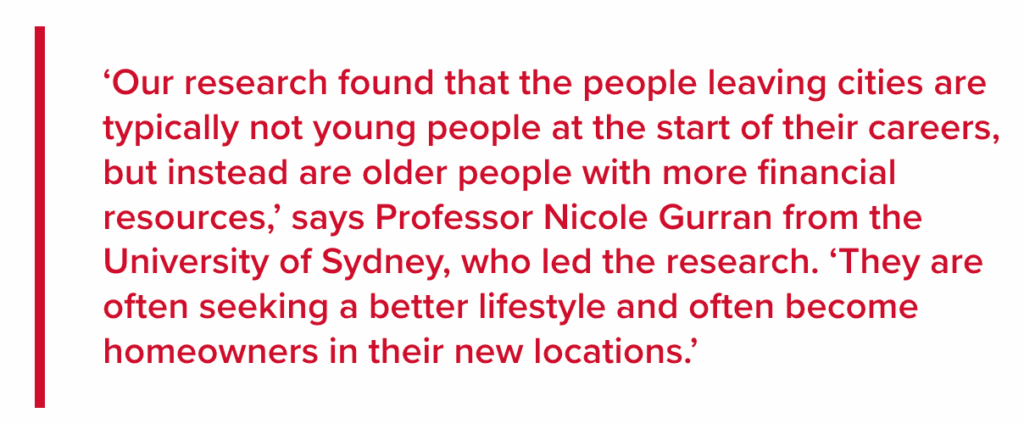
Another report by AHURI circles in on the movers themselves, highlighting that many are older, with more financial resources. This is commensurate with the profile of the clients we have supported to make the move to this wondrous coastal city. Our clients haven’t broadly been represented by the lower priced buyer segment at all, in fact they have almost all been represented by families and retirees. Their key motivation has been lifestyle and the value proposition that Geelong offers.
Those in search of great schools, large family homes within easy access to city, beach and/or the premium schools have been our broad base of Geelong intrastate movers.
A recent cross-section of house sales in the inner-Geelong suburbs yielded some interesting statistics. Much like last week’s Ballarat blog, I selected an array of recent sales which met the following criteria:
• Recent sales
• Three or more data points in history
• No obvious compromises on location/floorplan
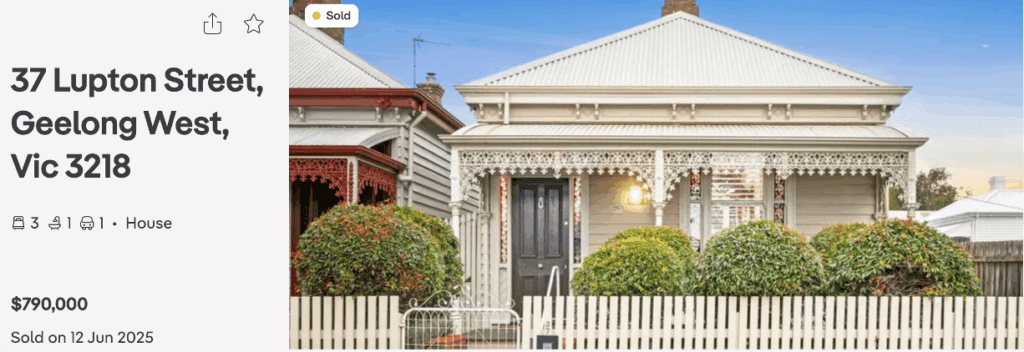
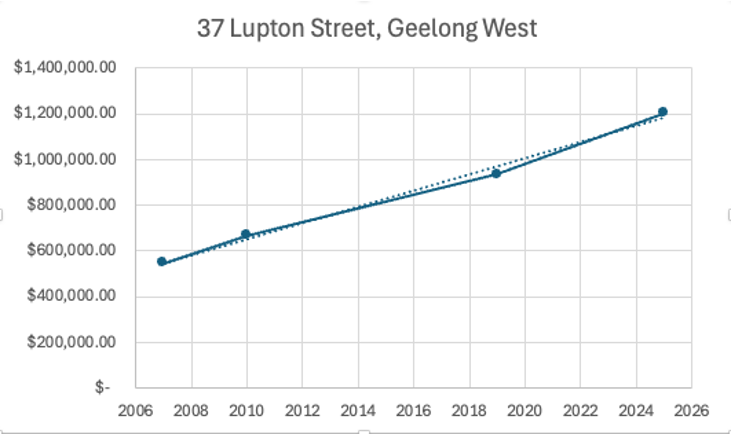
The first property in Geelong West demonstrated a line of best fit matching a 6.75% year on year growth rate since 2007.
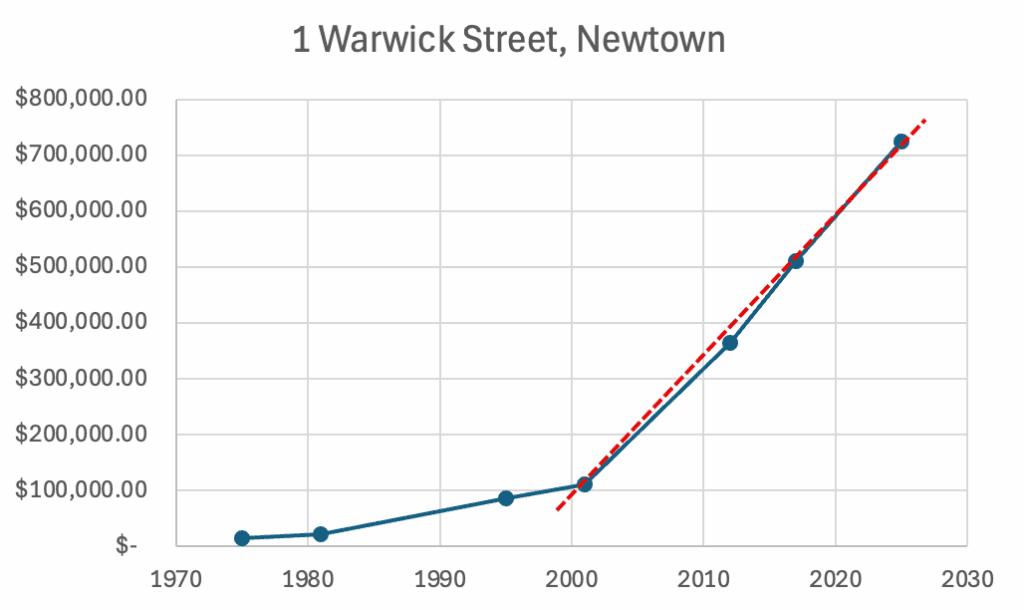
The second property assessed demonstrated an interesting chart. Two significantly different lines appear both pre- and post-2000, with the former representing a critical, and difficult time for Geelong. The collapse of the Pyramid Building Society in 1990 was a significant blow for the city, with many locals losing their life savings in this unfortunate event. Combined with the floating of the dollar, the subsequent high interest rate period, and the “recession we had to have”, Geelong’s recovery was slow and painful.
However, the recovery post-2000 has been evident across greater Geelong, and the population growth and new housing spread is evident in the data today.
As referenced above, Warwick Street Newtown’s historical growth has been plotted from seven sales data points, and shows a clear differential in the capital growth chart. Interestingly, when the latter half is plotted, the line of best fit since the 2001 data point shows an average annualised growth rate of 8.9% year on year.
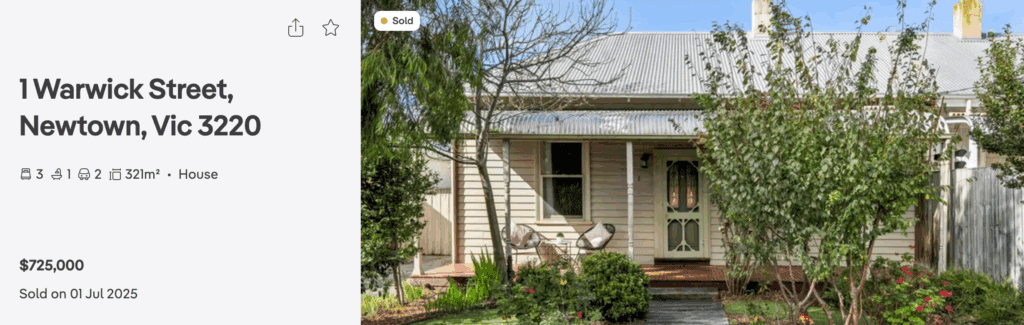
Despite the market conditions deteriorating following the 2022 interest rate increases, the growth rate is still significant by anyone’s measure. Combined with a reliable average house rental return above 3.5%, this Geelong property would be a standout in a balanced portfolio.
There is more to this city than just population growth and an increase in investor interest. The heightened number of higher income driven, intrastate and interstate migrants embracing Geelong hold it in good stead for future growth.