Optimal capital growth comes to those who are most patient

We always talk about the importance of holding property for a long tenure. An ideal tenure is greater than ten years, but what does it look like when that tenure is twenty years? Or even thirty years?
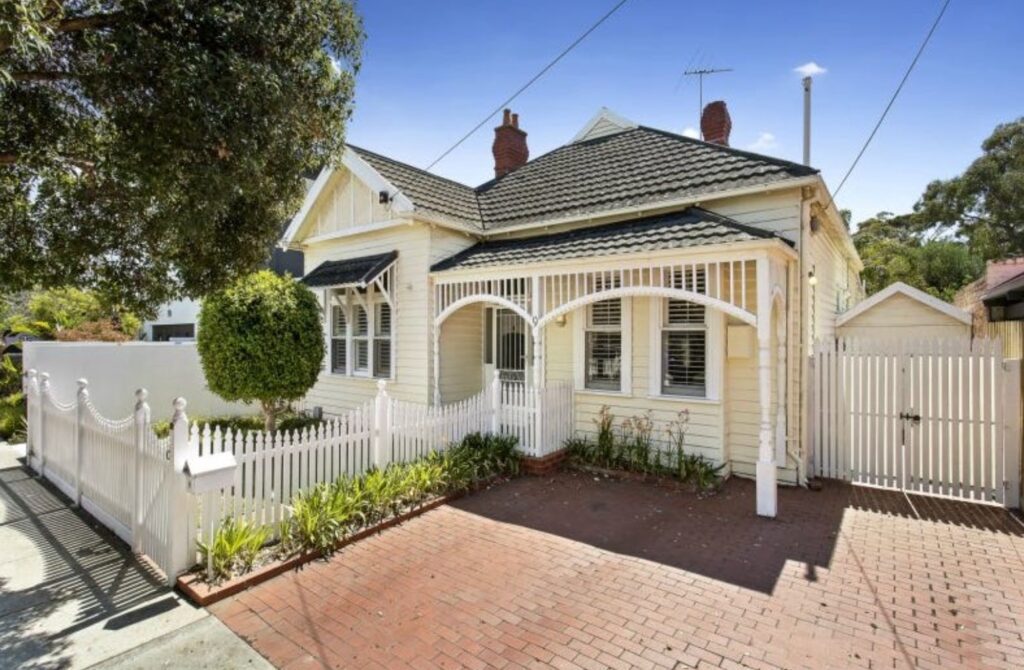
I was reminded of this only yesterday, when a dear past client sent me an email out of the blue. Back in mid 2004, I worked as a real estate agent in Sandringham for a great firm.

I had quit my corporate job and I was both terrified and excited about embarking on a new career. My new career move was brave, but also very rewarding. I met a gorgeous couple at an open for inspection. They had a clear idea of the type of house they wanted, but their challenge was distance. They were returning to their home overseas and planning the big move to Melbourne in another few months.
I dropped over one hundred letters in letterboxes around Hampton, targeting the pretty, period, family-sized homes. Two vendors responded, and his particular house was the one I eventually listed and sold off-market to the buyers. The price was $908,000.
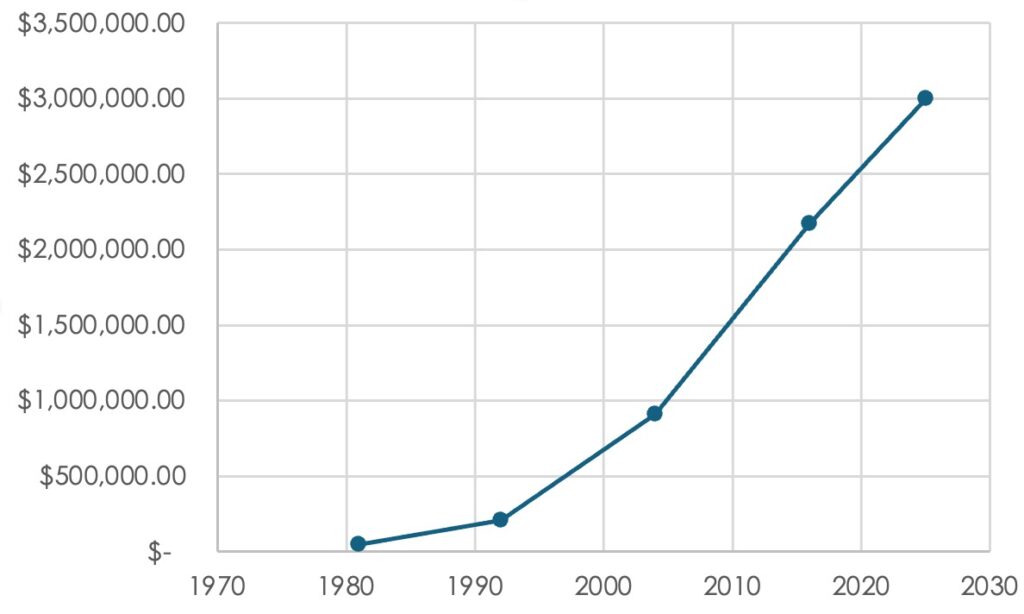
Winding the clock forward, recent comparable sales suggest this property’s value would now sit at around three million dollars. In twenty-one years, the property has exhibited an annualised return of 5.8%, which is not record breaking by any means. But it does demonstrate the power of a long term hold, even in a tougher market such as Melbourne.
The chart below paves out the sales history of the property for the past fifty years, with the final data point at my estimated appraisal.
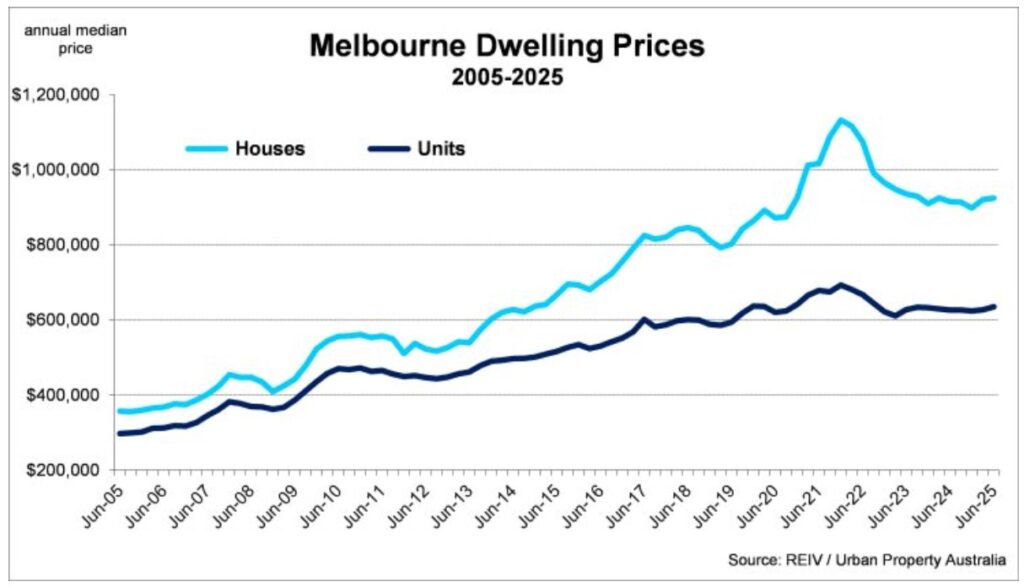
Melbourne’s previous three years have been particularly lacklustre, and any investor who purchased in 2021 would be justifiably disappointed in the performance of their property. However, standing back and looking at the historical performance of our city tells a vastly different story. The chart below shows dwelling prices over the past twenty years, and while the peak of early 2022 is quite an extreme set of data points, the overall trending of the charts is the point of this blog.
Who would have thought that back in 2004, this beautiful period house would have the same value as a villa unit in the same neighbourhood today?
Markets almost always demonstrate cyclic behaviours when it comes to capital growth. This year has marked the turning point of the Melbourne market, with positive capital growth occurring for every single month of the year.
We look forward to what 2026 will bring our property market, and in particular, the various segments of the market.
Wishing our clients, industry friends and blog readers a very safe and happy festive season.