Melbourne’s Highest-Performing Suburbs of 2025: Why Median Data Doesn’t Tell the Full Story
Melbourne’s median value property data throughout 2025 consistently showed a modest recovery. The only month to record a negative pace was December, albeit 0.1% for the month. Otherwise, the city’s growth in spite of the headwinds was encouraging. Melbourne’s annualised growth figure, (according to Cotality) was 4.8%.
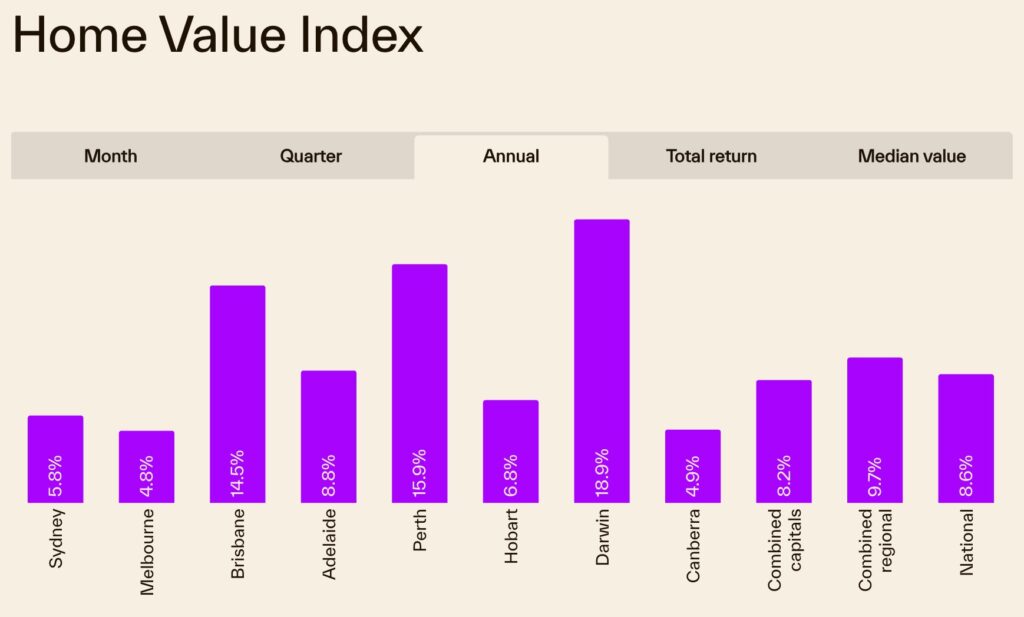
Source: Cotality
However, median value movement is merely generalised. Segmenting the data further tells the true story. Firstly, price segmentation gives us a few clues. This chart below (Cotality’s chart for the November market wrap) shows the mid price points were the ones to watch.
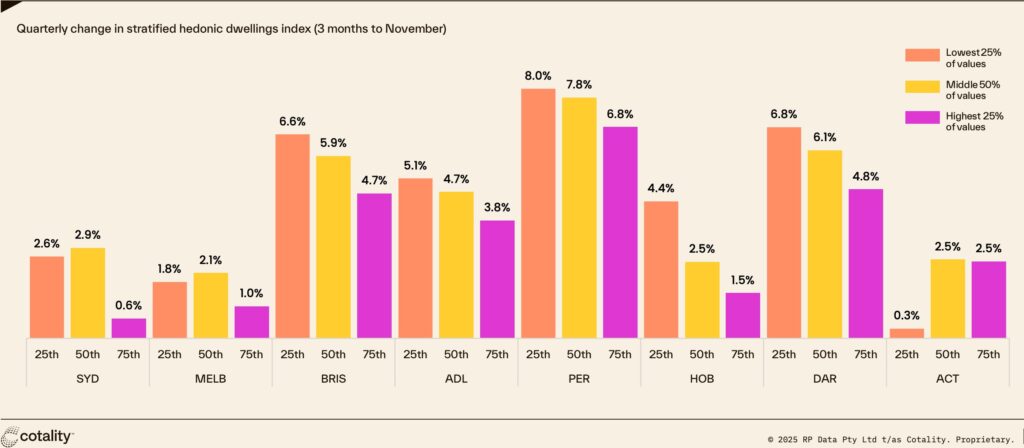
Source: Cotality
I wrote about the likely impact of the Federal Government’s First Homebuyer Deposit Scheme announcement in September last year. Once the scheme was introduced, first homebuyer activity did increase markedly.
The first question is: which markets delivered the strongest growth?
And the second question is: how did these markets fare when contrasted against other headline markets nationally?
Exploring market segmentation further across statistical local government areas, the picture becomes clearer.
In terms of median price movement, Darwin led the chase with 18.9% growth and Perth followed at 15.9% growth. Brisbane came in third with 14.5% growth.
Delving closer, the three capital cities had some stellar performers in the mix as follows.
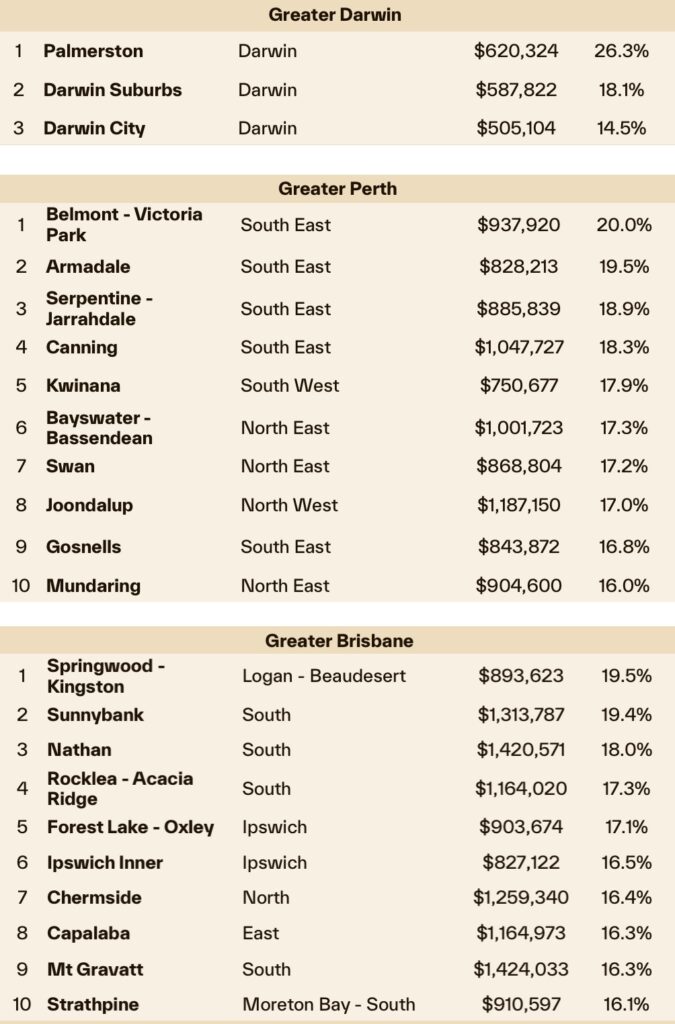
Source: Cotality
Darwin’s Palmerston’s region (20km SE of Darwin), Perth’s inner south-east, and Brisbane’s Logan area were the star performers. Each recorded 26.3%, 20% an 19.5% respectively.
But if we consider Melbourne’s top performers, the results aren’t quite representative of what the median data would suggest.
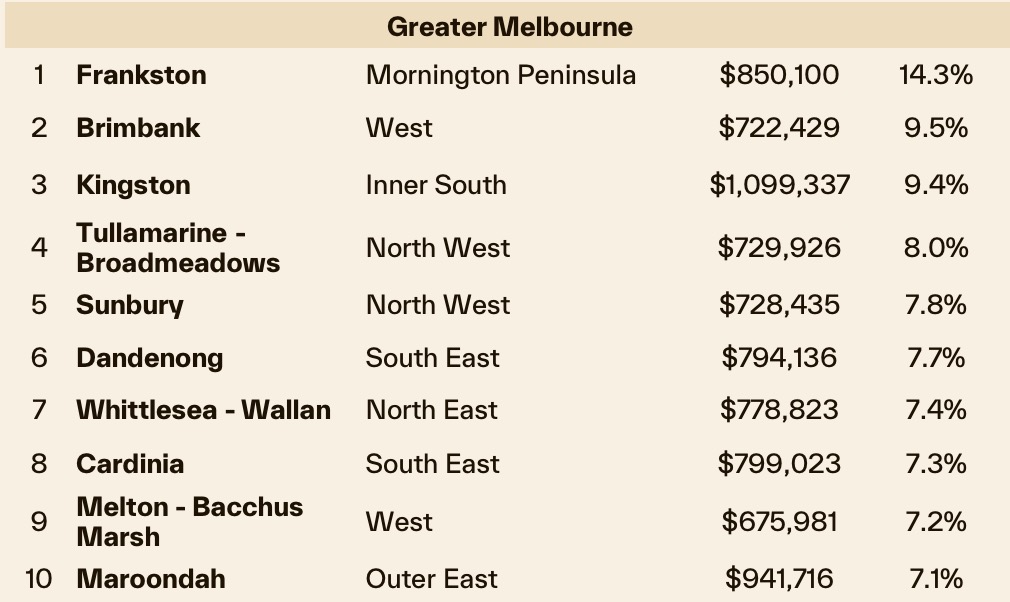
The local government areas that all fared above 9% growth for the year are as follows:
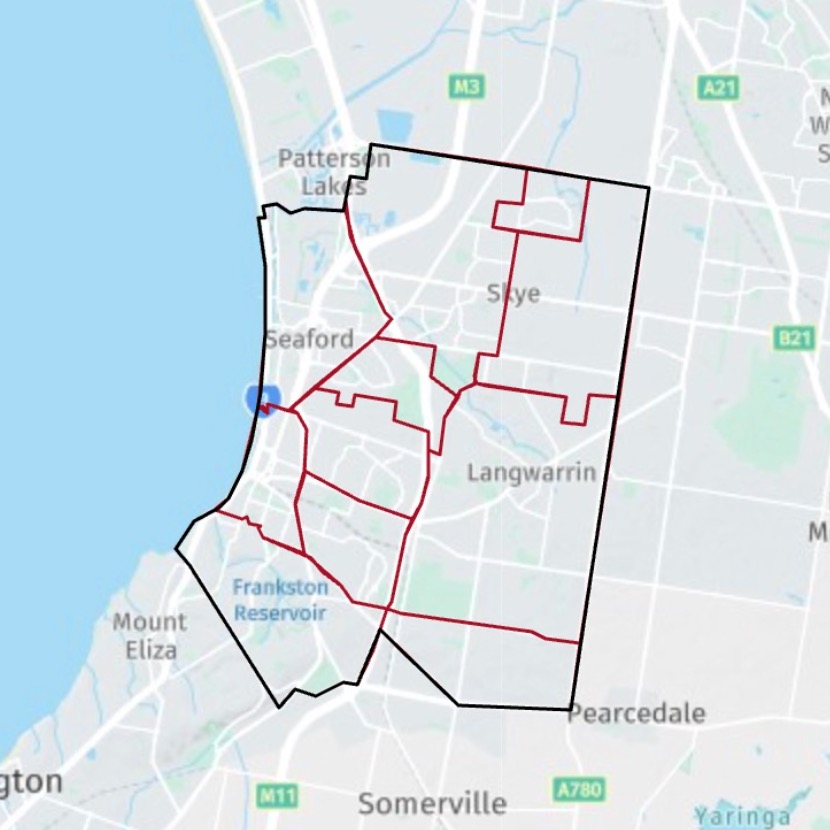
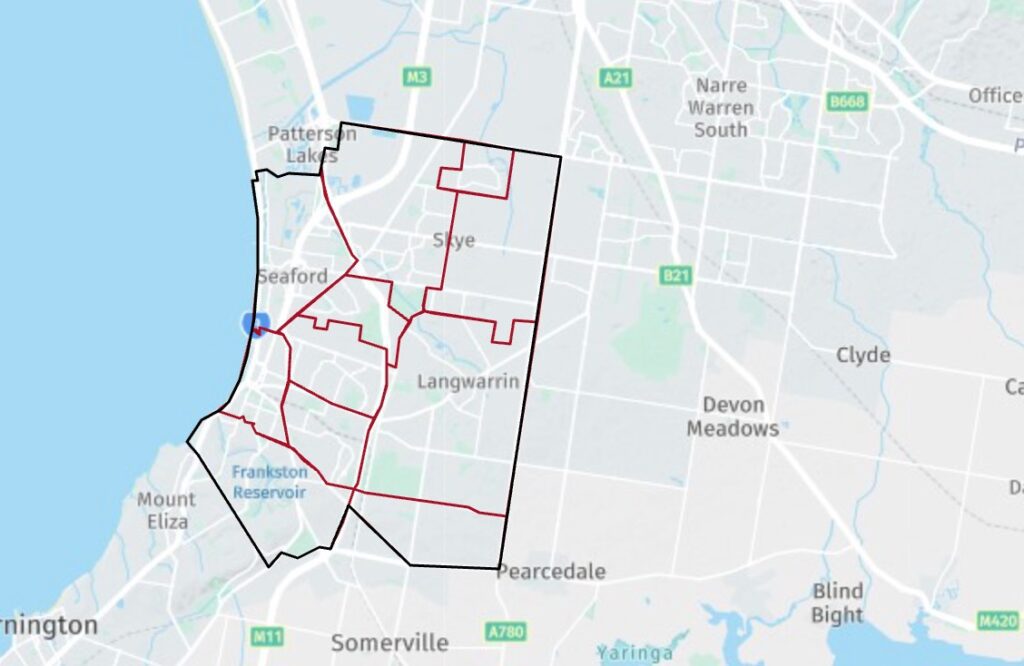
Frankston – including Carrum Downs, Seaford, Langwarrin and Skye.
Brimbank – covering Sunshine to Derrimutt, Sydenham, Hillside, Taylors Lakes and Keilor.
Kingston – from Carrum, Patterson Lakes, to Mentone and out to Clayton South and Oakleigh South.
Frankston city’s performance at 14.3% value growth belies any underperformance data, and serves as a great example of market segmentation.
In 2023, I wrote about areas where I’d consider investing $500,000 and Frankston was one of the areas. The amenity and relative value compared to other neighouring areas was obvious. I’ve consistently written about Brimbank too; an array of suburbs which offer sub-$950,000 freehold house opportunities for investors and first homebuyers alike. Many of which are within 20km of the CBD, and well supported by public transport infrastructure and freeway upgrades.
Looking forward at 2026, successful property investing is not about choosing a hot capital city. It’s about understanding the growth drivers of the respective states and cities, and knowing which areas are most likely to be impacted by sustained growth (and positive change).