Has the market peaked?

According to the media, yes…. but I think not. There is much more to measuring the peak of the market than auction clearance rates.
We are experiencing a tiny window of eased buying conditions, and when we take a careful look at the data, the story becomes quite clear….
The planets have aligned perfectly this late spring for buyers.
The first planet is that of stock volumes. Particularly in Melbourne, vendors’ plans to sell in 2020 and 2021 were totally hampered. Stop-start lockdowns, uncertainty about real estate restrictions and a total shut down for an extended period severely impacted our listing volumes.
Vendors were anxious about selling until they could be assured of a proper, uninterrupted campaign.
Sadly, for some the lockdowns took a hard toll on relationships. A large number of separations were evident as selling agents reported more than a few listings as a result of relationship breakdowns.
And it comes as no surprise that a considerable number of households made the decision to move away from Melbourne. Our interstate and regional migration data showed a notable number of Melburnian and Sydneysiders decided to pack up and move.
Once our restrictions lifted and vaccination rates enabled the real estate market to recommence trade, two years’ worth of pent-up selling decisions were made and our 2021 Spring market listings flooded the market like a tidal wave.
The interesting thing to note about Melbourne’s recommencement of trade was that the typical August and September listing activity as a pre-curser to hectic Spring auctions got pushed back to October. Our Spring market really because an early summer market. Our ‘super Saturday’ auctions have all been in December.
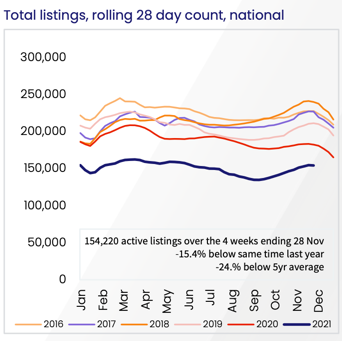
This chart tells a compelling story. Our current national volumes are at their highest peak, and Melbourne’s late rush for 2021 will most certainly be accounting for the lion’s share of late listing activity, (alongside Sydney and Canberra, which were also impacted by lockdowns).
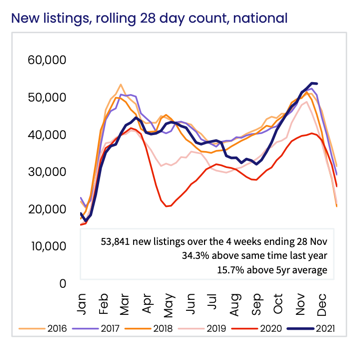
While heightened listing volumes have impacted the supply side of the equation, demand has reduced momentarily
Less buyers fighting it out is the second planet to align for those buyers who remain in the market.
Some will point to macro-prudential changes and talk about rising interest rates, but the reality is that many of us are enjoying our newfound freedoms. From Christmas parties to shopping, pub/cafe visits to hanging out with friends, we are all quite distracted.
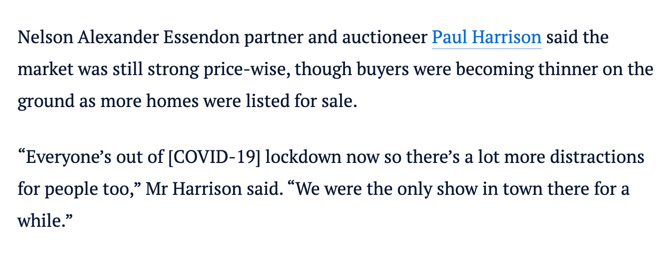
As Paul Harrison, (quoted below) points out, buyers turned to the property search engines during COVID lockdowns. Many purchases were precipitated out of boredom/trawling the internet. We had a surprising number of clients ask us to assist them with ‘unplanned’ purchases during this period.
Real estate really was the only show in town for a while, but things have changed this spring.
The third planet to align relates to building, (and builder) shortages. The costs of building/extending/renovating have soared and people know it. Vendors who would have previously considered extending or upgrading their home are now weighing up the increased costs, (and delays), and deciding to trade up, as opposed to staying put. We have increased our vendor count substantially with upgraders who, even when factoring in stamp duty and selling costs, have determined that it’s more cost-effective to sell and buy.
Reside Real Estate director Marty Rankin agreed, saying a two-speed market had started to appear in Melbourne.
“There’s renovated family homes and then there’s everything else,” Mr Rankin said.
(He) added that buyers were hesitant to buy fixer-uppers given the rising costs of building materials and shortage of builders, after a rush of home building during the pandemic.
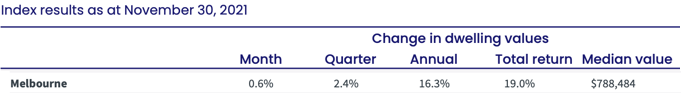
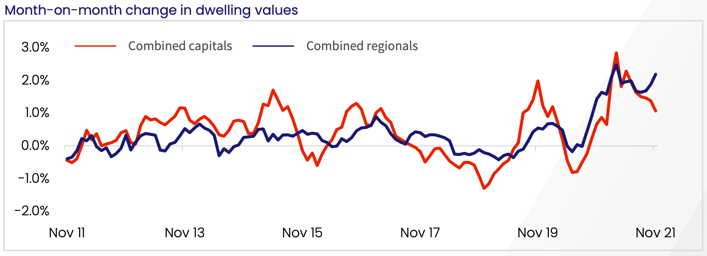
While our supply and demand ratio has eased substantially from the intense peaks of 2020 and 2021, we are still in a seller’s market. As the metrics below show; our annualised and quarterly growth when contrasted against the month of November shows that median value growth slightly eased for the month.
The chart illustrates this also, however things are still going strong in the regional markets.
We have some other critical indicators that also point to a continued seller’s market into 2022 and I don’t believe that the softened buying conditions are here to stay for a long period. Here are some important charts that explain why;
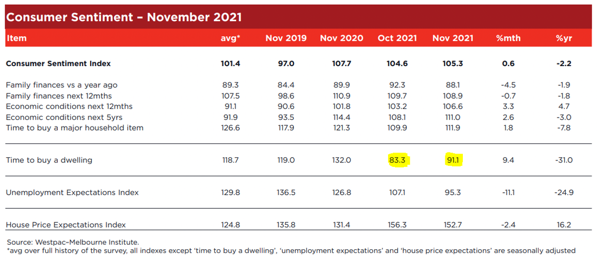
Consumer sentiment is still strong. While “time to buy a dwelling” is off it’s previous peak, we are still spending money.
While new listings are at record highs, total listings are at record lows. Our stock volumes, (inclusive of old 180+ day listings) are significantly tighter than previous years, (as shown below).
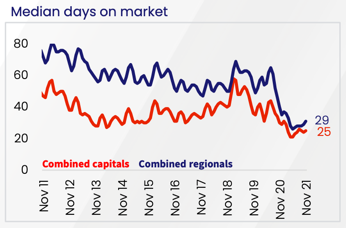
Days on market are a precise measure of demand. This Core Logic chart tells the story well and highlights just how extreme the supply/demand imbalance has been throughout the pandemic period.
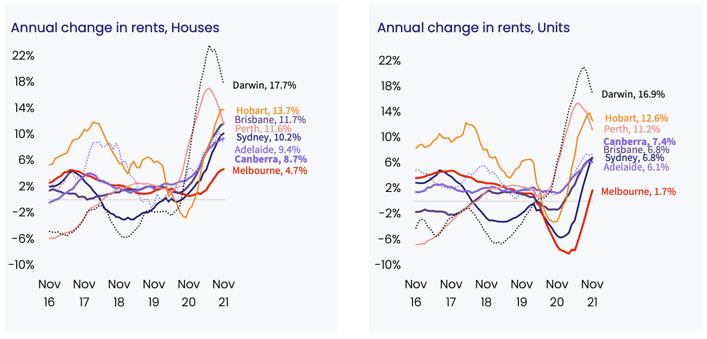
Vacancy rates cannot be excluded from the observations either. An obvious tightening indicates a rental stock shortage. This has been amplified by owner-occupier take up of properties that were previously on the rental market and sold by disenfranchised investors.
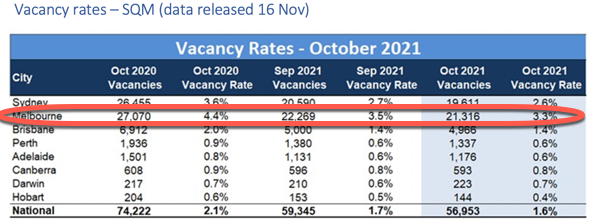
Nationally, our housing shortage for tenants has become a significant issue, but looking closer at Melbourne units, (which held the record for the highest vacancies and worst rental growth performance during 2020-2021) a ‘recovery’ (so to speak) is captured in the most recent few months of data.
Provided early 2022 doesn’t continue to offer up a deluge of new listings, I don’t envisage that the softened buying conditions we’re currently experiencing will continue. A federal election may initiate some buyer jitters, but our record low interest rates, strong (and continued) buyer demand, zest for our beautiful city, builder shortage and reopening of international borders will likely re-align the other planets in favour of the sellers again.