How do interest rates impact capital growth?
For ten days now, I’ve been asked this question. I’ve reflected on the stark contrast between this month’s consumer reaction to a 0.25% rate increase, versus our reaction to such an increase in the years that consecutive rate increases were applied.
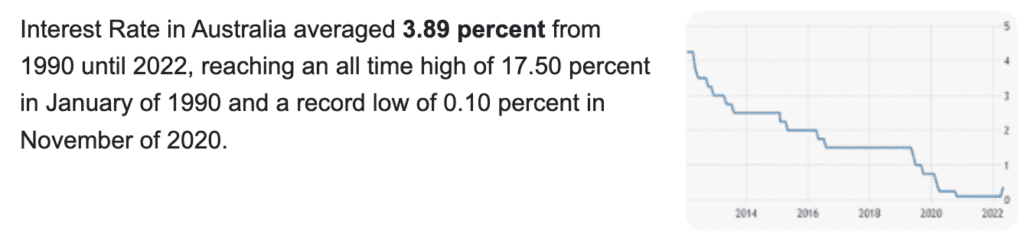
For owner occupiers and investors alike, as much as we didn’t like the rate increases, we were quite accustomed to rate movements in the decades preceding 2011.
The reason why this month’s rate increase is so palpable is due to rate increases being an unfamiliar experience for many. In fact, the last eleven years have conditioned many of us to expect that record-low interest rates are normal, yet they aren’t.
The media headlines have ranged from scare-tactics to predictions that nobody, (including the best economists) can predict. The reality is that +0.25% is not going to cripple the Australian property market, and even if our reserve bank applies consecutive rate increases over the coming months/years, our economy is in good shape.
However, in fairness to every mortgage holder who is concerned about how rate increases are likely to impact them, we must consider the immediate flow-on effects of a rate increase.
First and foremost, for all variable interest rate customers, our hip pockets are hit. Any interest rate increase that is applied to a loan means that the monthly mortgage cost increases. Our discretionary incomes are reduced, and we feel that our savings capacity is somewhat eroded.
Secondly, for those prospective buyers who are keen to purchase, maximum borrowing capacity decreases. The servicing buffers applied to every applicant (currently a +3% buffer) are increased by the lender in a prudent measure to ensure that the consumer could still repay their loan in the event of a three hundred basis point increase over time). Maximum borrowing capacity is an interesting point, because not everybody borrows to their maximum. In fact, in my experience with buyers, most are more conservative and don’t take their lending to the extreme that the lenders are offering.
The third impact is an interesting one and it relates to human nature. When we apply any kind of financial shock, prospective buyers tend to step back and some panic. While there isn’t a rational reason to do so, we see it all the time. This particular rate hike is further amplified by the looming federal election date, and it’s been particularly noticeable.
What is the bigger fear?
The fear among property buyers and owners alike isn’t really about loan repayment affordability, at least not right now while the cash rate sits at 0.35%. The bigger fear is actually about the impact of a rate rise on house prices.

Buyers are wondering if now is a good time to buy. They are pondering whether a rate rise, (or consecutive rate rises) could deflate prices and give way to an opportunistic purchase later in the year, (or even next year).
It’s a natural concept to ponder because real money is at stake.
While we can’t predict whether that opportunity will indeed present for prospective buyers, we can look at history. After all, it’s often our best teacher.
I spotted an article in the paper just last week, suggesting that there was a correlation between house prices and interest rates. It suggested that interest rate rises were inversely proportional house price increases. In other words, the article suggested that rate rises equate to falling house prices. I had to look into that claim further, because I’m familiar with plenty of studies and charts that contradict this.
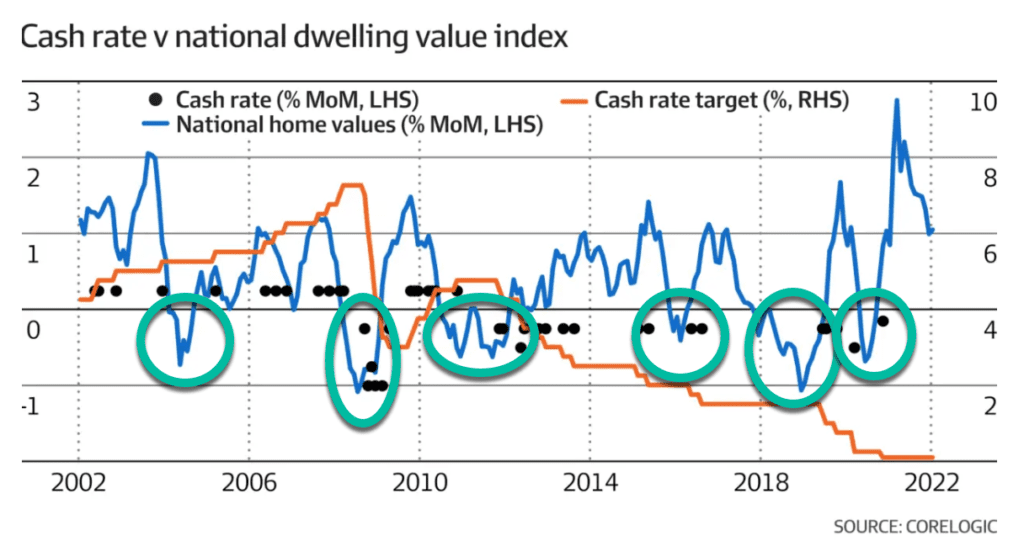
This CoreLogic chart below overlays national home values with our cash rate movements and dates back over the past twenty years. I’ve highlighted negative price movement in green. Some could argue that 2008’s interest rate increase coincided with a housing shock, but we have to remember that a far bigger issue was at play; the GFC.
The negative house price movement in 2011 and 2012 did correlate with heightening interest rates, but the house price movement was particularly static and very inconsistent across our capital cities, (which highlights another point; not all markets are equal). The two years of 2011 and 2012 aside though, the following three house price corrections were all during a period of decreasing cash rate movements.
It’s fair to say that none of these below represent a direct correlation. In fact, the sharpest property price downturn struck in 2019 and soon after in 2020, and these were at a time when the cash rate was plummeting fast.
Looking further back reflects similar observations; that there is no clear correlation between increasing interest rates and decreasing house prices. In fact, in the lead up to 1990 when interest rates peaked, house prices did not tumble. All of the sharp hikes circled in green demonstrate either static or increasing house price growth at the same time as sharp increases to our cash rate being applied. The yellow square is certainly a period of time that I remember well. Our cash rate only moved in an upwards trajectory, and at the same time house price growth ensued.
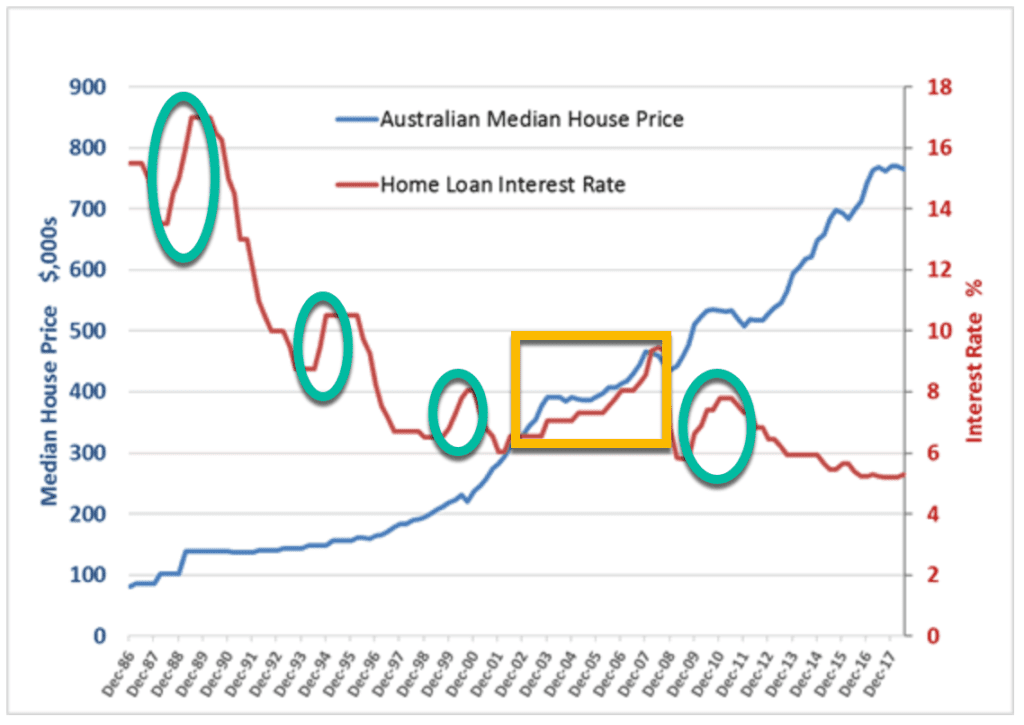
This chart shows that median house prices have broadly moved some $800,000 over the past thirty years.
In percentage terms, this equates to over 400% capital growth.

If we talk to any investor who has actively held property over this timeframe, (or even a reasonable portion of this timeframe) they may talk about the challenges they faced when paying hefty interest rates during the period leading up to floating the Australian dollar (bank deregulation), but they will also openly discuss the fact that interest rate fluctuation was factored into their investment journey as a cost of doing business, and something they had to provision for.
Property investing is a long game, and does not generally welcome trader activity. The associated costs of buying and selling, (including capital gains tax implications) can quickly erode any profits made on quick flips.
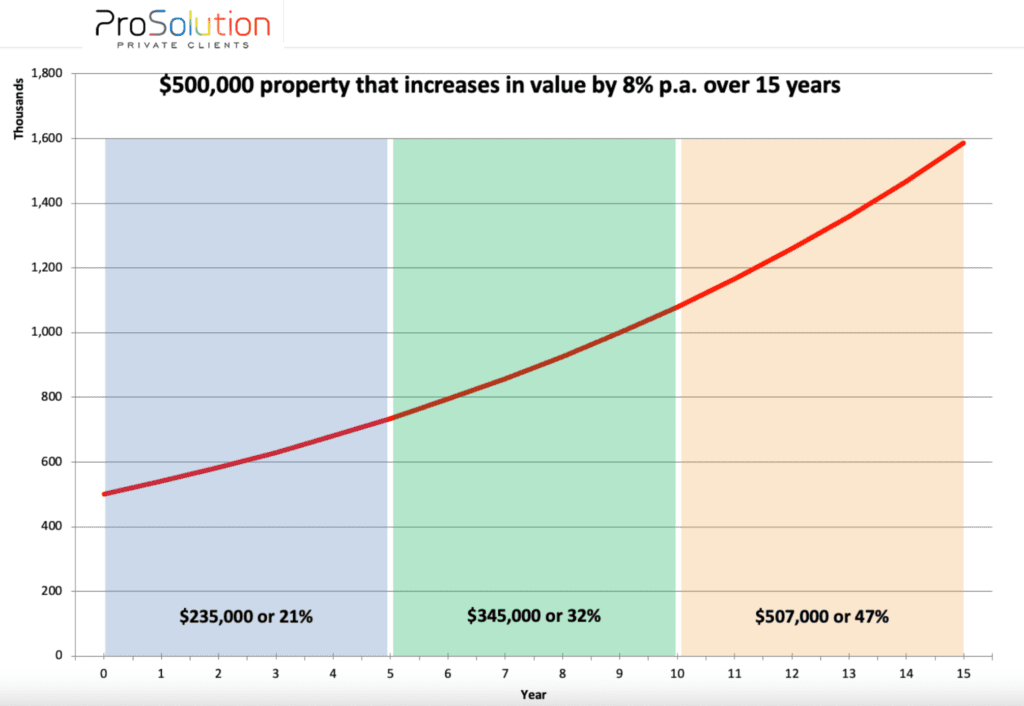
This chart from our friends at ProSolution is simple, but fabulous. It’s one of my favourite illustrations of time and the impact on wealth creation when it comes to property investing. It showcases the power of compounding interest superbly. Even with a steady annualised rate of return, the pot of equity strengthens at a greater rate with every five year increment that the property is held. The third five year period accounts for almost half of the growth, even though it is only representative of a third of the ownership tenure.
Imagine what the final five years’ growth would represent as a total proportion of the growth if the investor held the asset for another five years? Or even another?
Taking this all into account; the rate of capital growth sustained for Australian property over the course of the last thirty years, combined with the fact that interest rates have been significantly higher over this period, (and at times volatile), and noting that true success in applying property investing to create wealth hinges on a long term approach, I have to respond to anyone with “why?” when they ask me whether they should hold off purchasing property when interest rates move upwards.
In terms of opportune conditions though, buyer caution over the short term means that we have a window of opportunity while nervous buyers adjust from the old norm to the new reality. This window still offers reasonable, (but declining) stock volumes, subdued buyer activity and slightly eased competition levels. We are, by no means in a buyer’s market, but the market conditions are not as tough on buyers as 2021 proved to be.