How do interest rates impact investors?

The rental crisis is headline in our national media stories, and sadly it’s not going to get better soon. The Housing Accord Australia progress is questionable at best, hampered by a combination of higher materials costs and a skills shortage in the building sector. Despite the best of intentions, we are not on track to deliver the social housing that was planned. To compound the issue, the number of homes due to be constructed is insufficient to meet demand.
Turning to private providers would seem the logical thing to do, particularly given government ownership of all rental housing in Australia spans only 9% of the total supply.
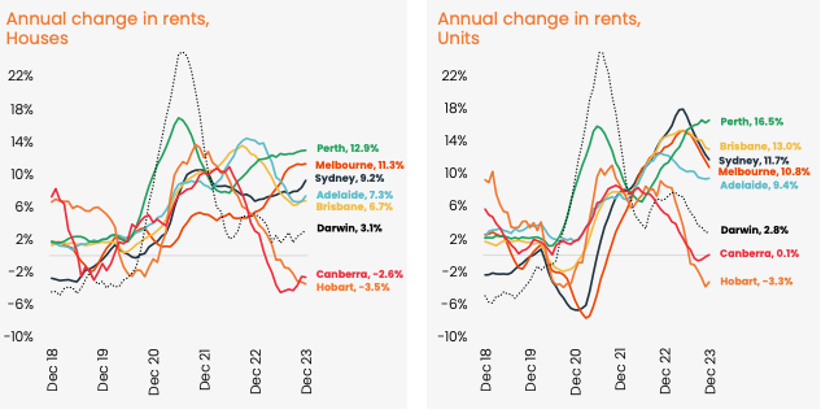
Unfortunately the narrative of ‘The Greedy Landlord‘ remains the biggest threat to this option. And in tandem with increased interest rates, the cost of owning an investment property has skyrocketed for a lot of Australians. There is no doubt that exiting investors are having a direct impact on rental movement. Victoria has outperformed all states and territories on our exit rate, and our rental increases are palpable for renters.
Let’s firstly consider the breakdown of states and territories. This chart shows the number of rental properties by state of property (as opposed to domicile of investor).
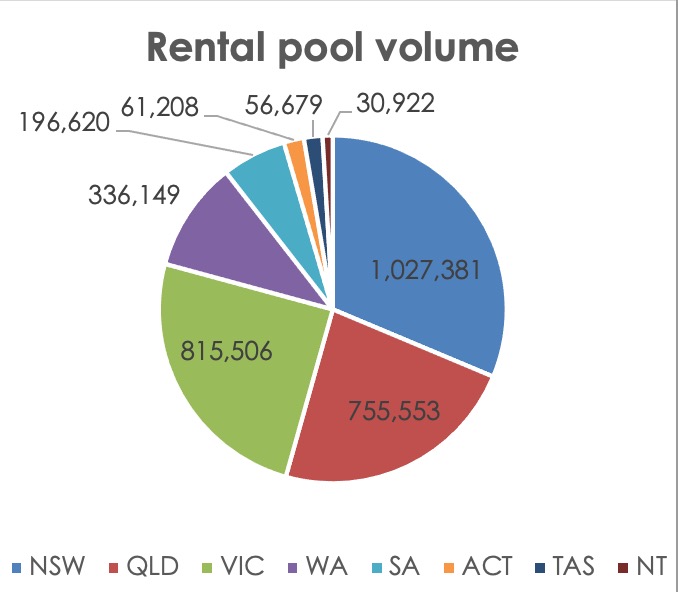
The three eastern seaboard states have lion’s share of investment properties with NSW leading the charge.
‘Out of pocket’ expenses is often a precariously balanced figure for individual investors. Depending on a host of variable expenditures, an investment property can range from positive-cashflow to negative-cashflow (literally) over night. Interest rates and taxes are the two significant variables that carry much weight, but vacancy rates and heightened maintenance costs due to tighter minimum standards are two more to consider. This chart below shows the annual interest expenses that Aussie investors have faced in each financial year. (Note (f) denotes that data is still incomplete du to data lags).
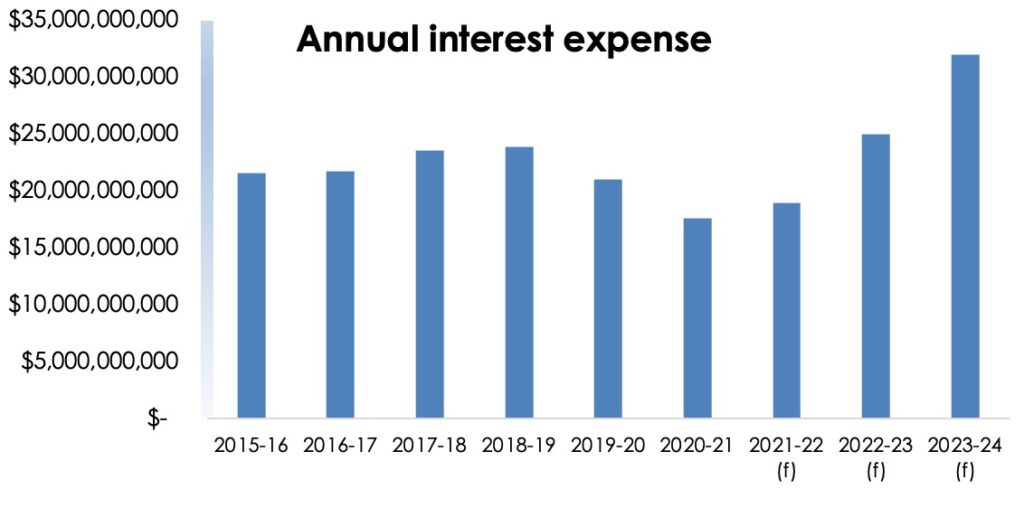
The COVID years of emergency interest rates are behind us now. We will look back at this period as an anomaly, and the following chart illustrates just how unusual these record low rates were for our nation.
The blue lines show the magnitude of investor ‘losses’ for each financial year, yet 2020/2021 shows a significant profit. This chart is overlaid with the cash rate (in red). I pay credit to Simon Pressley from Propertyology who has provided me with the data he poured hours over. Simon has captured the entire range of tax deductable losses over this period, ranging from maintenance to property management costs, body corporate fees to advertising expenses, and everything in between.
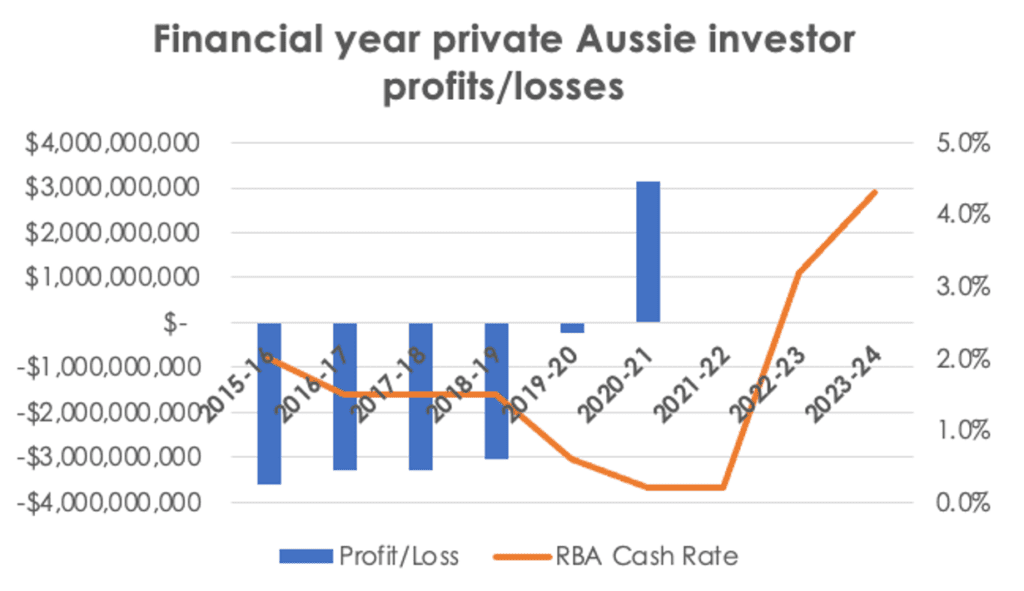
It is fair to assume that we will never see interest rates as low as the COVID emergency levels again, but the relationship between interest rates and holding costs is a significant one nevertheless.
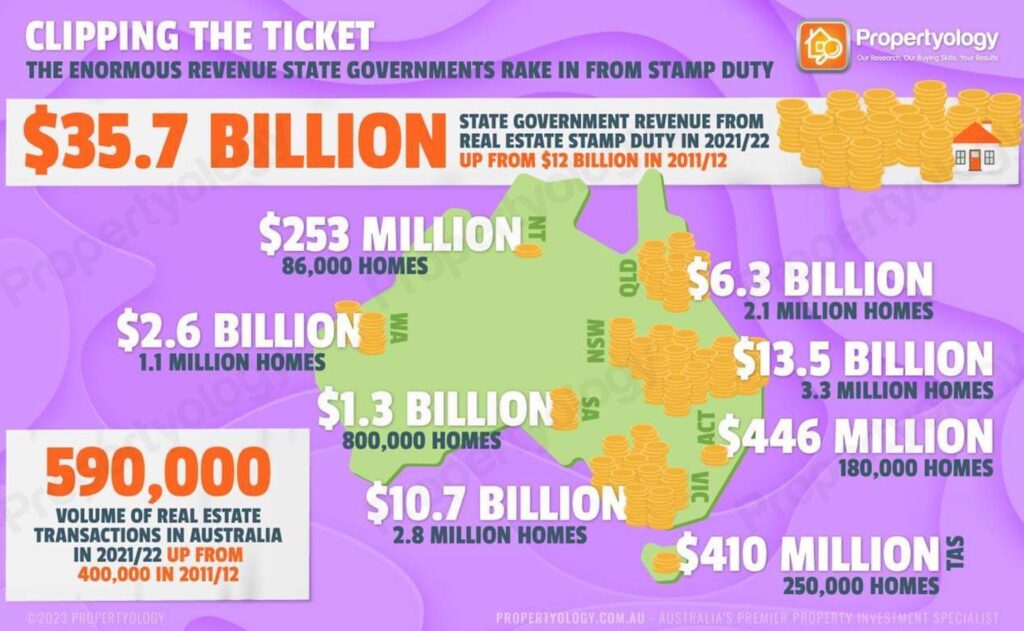
While recent debate has circled in on the cost of negative gearing to the tax payer, we must balance the conversation. We have to consider the revenues that our state and federal governments reap from investors. Simon’s chart below shows an enormous figure of $35.7B worth of combined state government stamp duty revenues alone, over a ten year period. Land tax is yet another source of income, and one that will be in question if investor numbers continue to fall.
The ‘cost’ of a rapid decline in investor numbers has to be projected too. Who will provide the housing?
Whether we like it or not, our state and federal governments can’t provide shelter in the numbers they proposed, and nor are these numbers adequate when we consider the rate of exiting investors. The cost of running an investment portfolio, (whether that be one property or more) is sizeable, particularly at the commencement of an investor’s portfolio.
Being cognisant of the real numbers is a positive step to understanding the rental crisis.
References:
Thank you to Simon for generously handing me the cut ATO spreadsheet.
Taxation statistics 2020–21 Table 26: Individuals Rental property schedule items, by state/territory1 of property and net rent position2, 2012–13 to 2020–21 income years3
Notes: * Totals may not equal the sum of components due to rounding. * In order to meet privacy regulations, some items may not be included, or data for some groups may be aggregated with other groups.
1 The state/territory location of the rental property as per the rental property schedule.
2 Net rent is as reported for each rental property schedule lodged.
3 Data includes rental property schedules processed up to 31 October of the following year. For example, data for the 2019–20 income year includes data processed up to 31 October 2021.
The statistics are not necessarily complete.
4 This data is at the rental property schedule level, and is not representative of the total number of properties, or the total number of individuals with a rental property.
The same property can have more than one individual with an interest in any income year (joint owners, or different owners – buy and sell). An individual can also have an interest in more than one rental property in an income year.
5 The data from rental property schedules may not necessarily match the data reported on income tax returns.
6 Refers to the label on the rental property schedule and will not necessarily equal the sum of component labels.