Investor activity has increased markedly over the past two years. The previous peak of property investment activity was during our post-COVID era, when interest rates were reduced to record lows. This Cotality chart below shows the impact of successive interest rate cuts from May 2022. Buyer activity slowed across both investors and owner-occupiers, but once our cash rate stabilised, investors returned. As chatter increased about interest rate cuts, investor activity grew sharply.
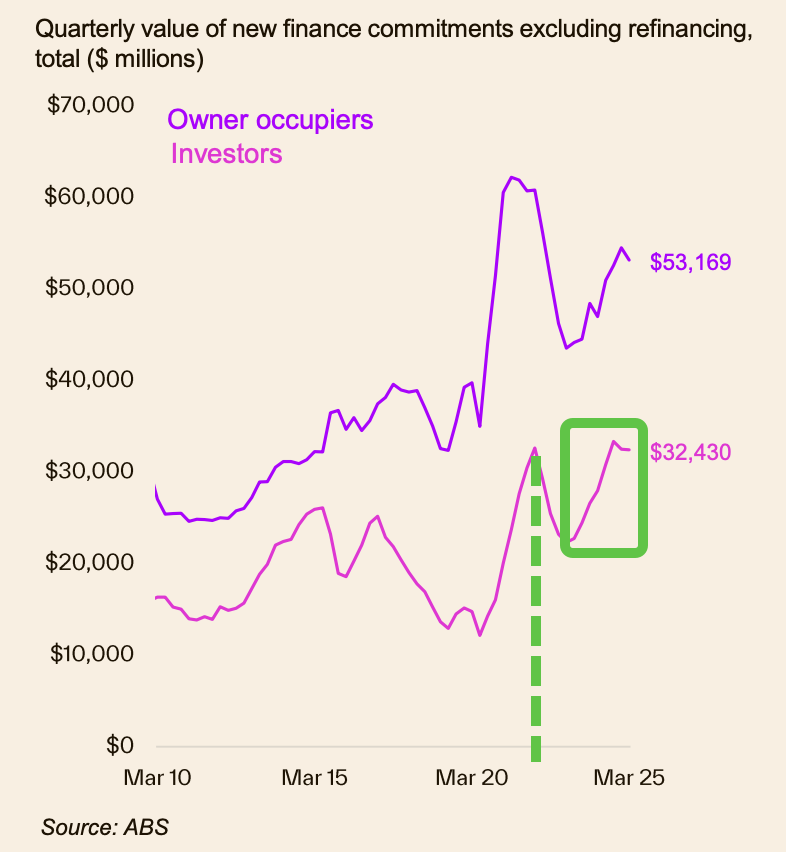
The second chart shows what is really going on, though. When interest rate cycles tighten, borrowing capacity is reduced. Household savings are often impacted too, with some households depleting their buffer savings to accommodate higher interest repayments.
In tougher economic times, homebuyers often turn to lower priced options as they downsize and downgrade. Investors circle lower options that align with their reduced buying power. As this chart from Cotality below shows, for almost all capital cities, the lowest quartile priced properties have experienced the strongest gains recently.
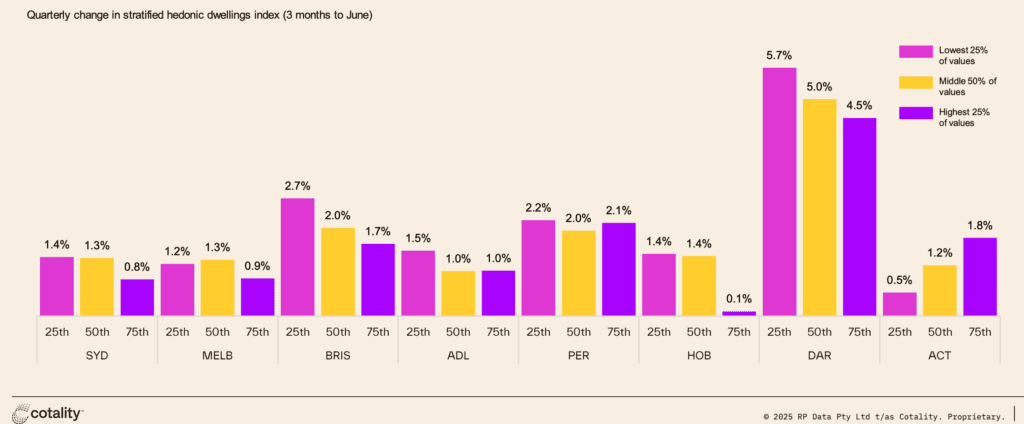
There comes a challenge for investors and homebuyers at these lower quartile price points. Increased competition can cause an area to surge. While localised gains are great, no property owner wants to purchase during a heady run that is fuelled predominantly by investors.
Data analytics plays an ever-increasing role in the identification of areas that are bound to be highly competitive, and this needs to be considered too. Independent investors, and some large buyers agent firms subscribe to data-house portals, some of which attract large volumes of clients.
While the accuracy of these predictive models is not being questioned, the surge in investor activity certainly is. Many investors are of the mindset that optimum capital growth performance can only be achieved with house purchases, (as opposed to units). In a restricted-borrowing capacity market, buyers are forced to focus on the entry-price houses. The more affordable houses in capital cities aren’t blue chip, and from a socio-economic point of view, many of these suburbs have a higher public housing count too. Plenty of these areas are also in fringe locations, with new house and land releases posing a threat to the established surrounding markets.
The question I have is…. when the predictive models suggest the next favoured suburb (or state), what happens to the areas that were yesterday’s “hot spot”?
How can investors ensure that they are selecting an asset that will deliver long term growth, and not just a quick burst of uplift due to competing investor activity?
Investors need to consider what the important, and sustainable long term growth drivers are. Owner-occupier appeal is one of the greatest drivers. When household incomes into an area are increasing, this can reflect an increased level of adoption from buyers who have the means to compete harder for a given area.
But what attributes attract higher income earners to an area?
A whole host of attributes can do this. Amenity is a well-used word.
It hinges around access to things we need and love.
From cafes and restaurants, to parks and trails. Public transport links for easy trips into the city. Major employers, access to the city, and easy access to the places we love to visit on weekends. This may include beaches, rivers, shopping malls or the airport. School access is also an important one, but it’s only relevant in the areas where families are likely to want to live. Inner-urban lifestyle isn’t all about schools.
When an area attracts emotional, committed owner-occupiers, the auction and sale results reflect this. Unlike a hotspot that could fall out of favour in a season, a suburb that has genuine and sustained growth drivers will deliver long-term performance.
REGISTER TO OUR NEWSLETTER
INFORMATION
CONTACT US
1A/58 ANDERSON STREET,
YARRAVILLE VIC 3013
0422 638 362
03 7000 6026
CATE@CATEBAKOS.COM.AU