What are we spending our money on NOW?

Three weeks ago I wrote about an emerging trend at our coalface; a marked increase in buyer enquiry and activity for holiday houses and regional tree-change and sea-change properties.

Following that Sunday Blog, I explored where our discretionary spending as a nation used to go, and what our COVID-19 lockdown measures have altered. The focus of that piece was on overseas travel and the sheer magnitude of money we Australians have taken to foreign shores.
A whopping $65B was spent on overseas travel last financial year.*
*The Guardian, June 2020
This week I’m exploring discretionary spending and questioning how this has changed since COVID, the segments of our population who will likely continue to spend, and where their savings could be channelled.
The chart below shows our weekly household income change since 1997 to 2018, in both median (mid-point) and mean (average) with equalisation for each. The differential between the blue and green line demonstrates that the average household income is far greater than the mid-point data point for household income, signalling a strong representation of high wealth from a small contingent.
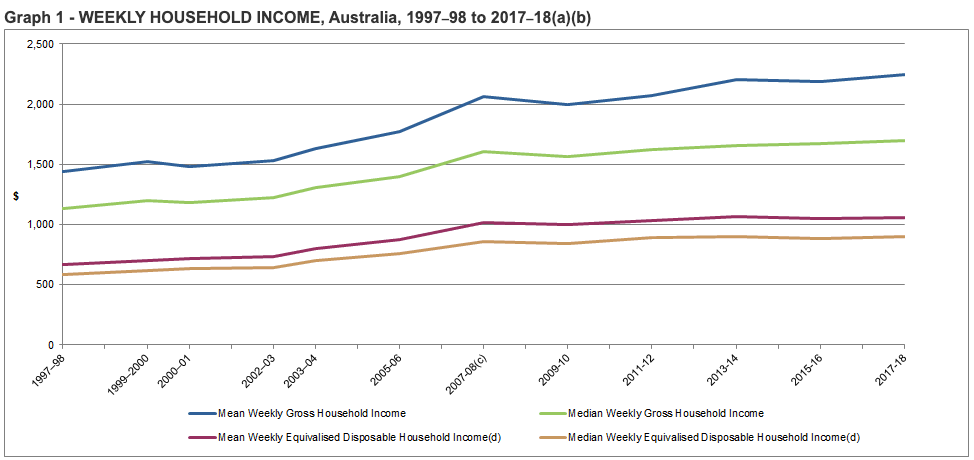
The question in 2020 relates to high net wealth individuals and the impact from COVID-19 on their wealth position now.
Are richest in our nation more or less resilient to our current conditions?
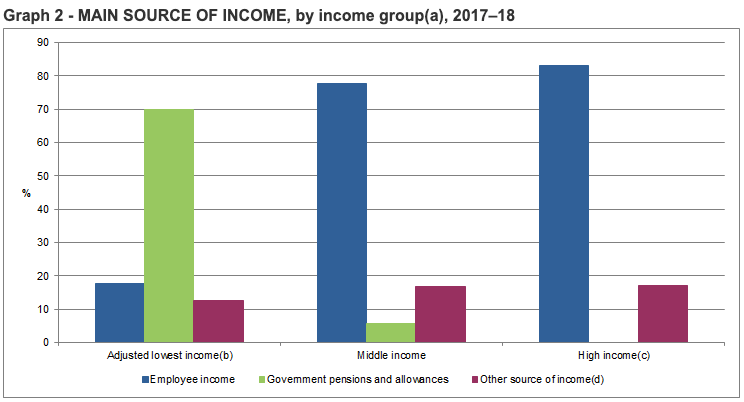
The graph below shows the main source in income for low, middle and high income earners for the same time period; 2017/2018. We can anticipate a greater proportion of Government allowances (green) all contingents in 2020 as a result of our Jobkeeper, Jobseeker, Tax Witholding and other COVID-19 business relief packages.
Prior to COVID-19, Australian spending habits were captured well in our last Census data collection, and household finances per household in 2016, as represented by this chart below show an age group breakdown of;
- disposable income,
- consumption, and
- superannuation drawdowns
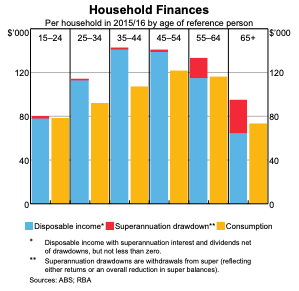
Our ‘savers’ in this chart are, (unsurprisingly) the 25’s to 45’s, with our 55+’s enjoying an uptick in spending. Interestingly, however this latter group is the age group who have significantly reduced their spending during COVID-19.
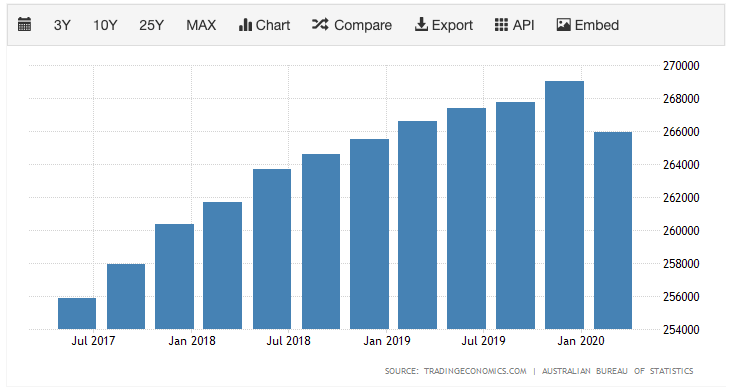
As shown below, consumer spending in 2020 has plunged, undoubtedly due to a combination of;
- household financial stress, (fears/inability to meet commitments),
- a preparedness to save and build a ‘war chest’,
- an inability to spend due to travel restrictions, restaurant closure, beautician/salon closure and recreation facility closure, (among others).
So what did we used to spend our discretionary dollars on?
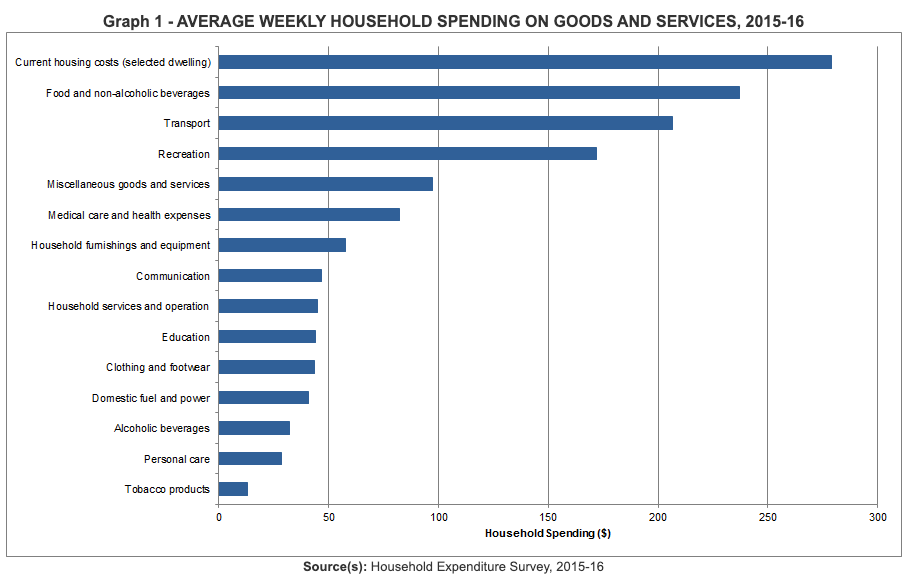
This chart below (dated 2016) shows a in weekly dollar spend what the average Australian household has consumed. Not all are discretionary, (in fact the significant costs are mostly essential), but recreation, personal care, clothing and alcohol count for a notable portion.
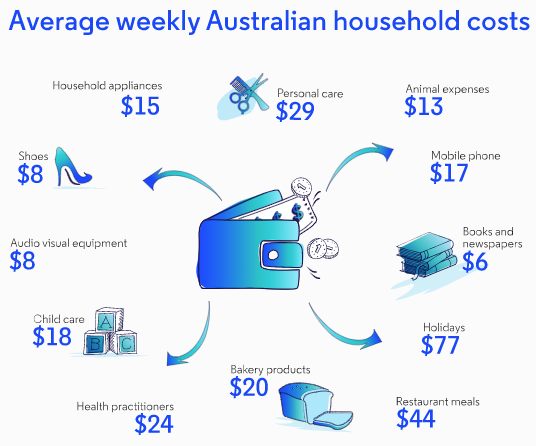
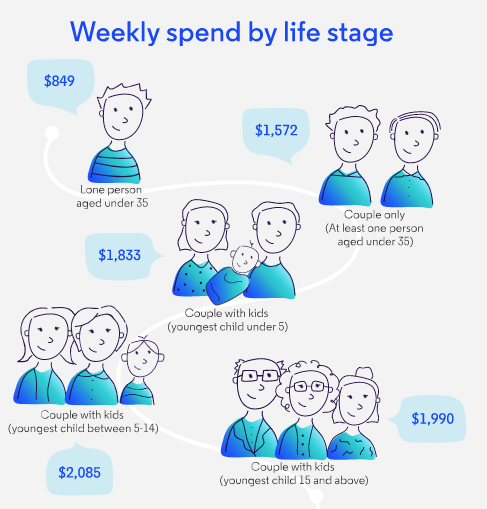
These two infographics from MoneySmart below weave an interesting reflection. Holidays, restaurants and personal care are the three headline costs after housing and essential items are stripped out.
And for our salary earners, it’s our couples with kids who seemed to enjoy their spending during this time.
A lot has changed since COVID-19
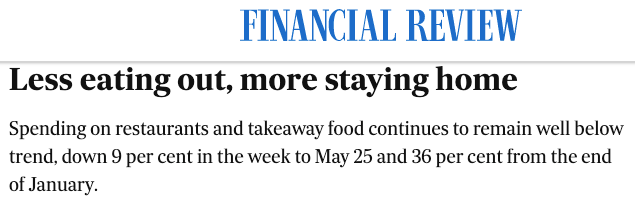
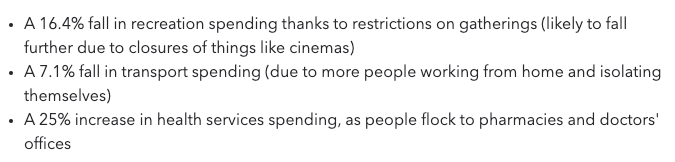
As pointed out in the AFR, (among many newspapers) our spending on ‘going out’ has dropped dramatically.
As reported in a CommBank study, the decrease in recreational and transport is notable and this is apportioned to the closure of facilities and offices. However the pharmaceutical and medical expenditure is considerably higher, (25%).
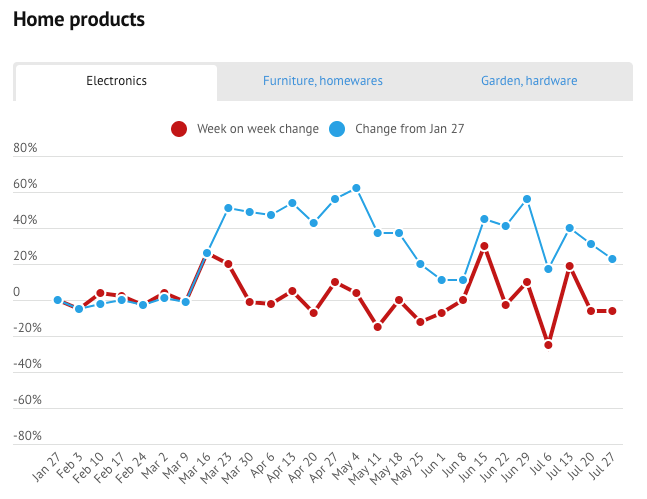
From a lifestyle point of view, however, the following two charts are insightful and illustrate an interesting trend. The first relates to household electronics. From larger, improved television sets to home office tech, our consumer habits demonstrate a significant change as a direct result of COVID-19.
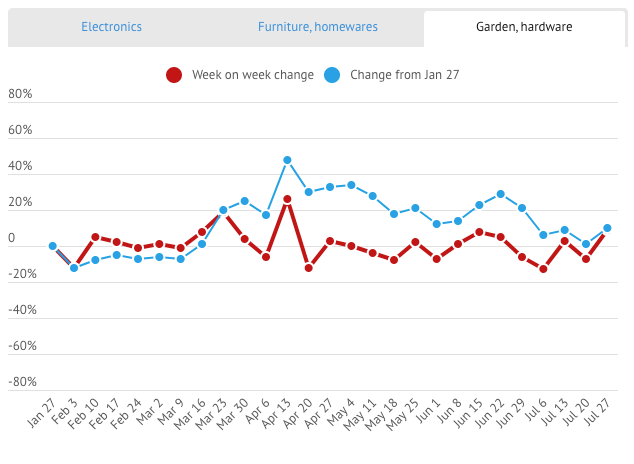
Garden and hardware is the surprising chart. It shows an increase over the entire COVID-19 restriction period, indicating that many households have turned their attention towards green-thumb activity and home improvement.
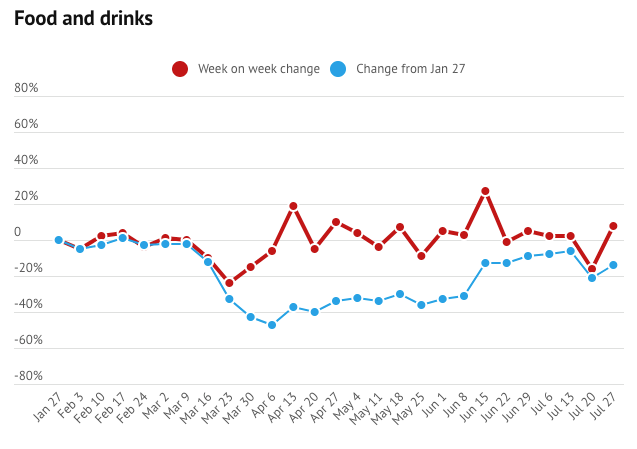
And unsurprisingly, food and drink spending is down; a direct correlation between COVID-19 restrictions and ‘drinking and dining out’.
The imminent data releases over the coming months will be particularly telling when it comes to lifestyle moves, investment in domestic holidays, holiday house adoption and increased floor area uptake in dwelling purchases.
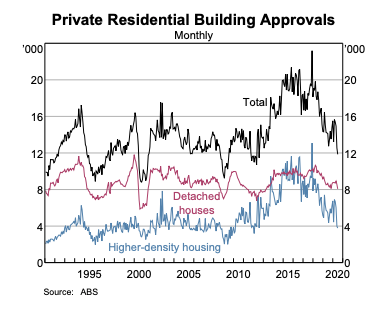
Despite the fact that our new arrivals (migration) numbers are zero now, our new building approvals and construction figures are also down.
It will be very interesting to gauge how our shift from high density, inner city property and change of owner-occupier needs are met going forward.