What the MCG Rental Loss Index tells investors
Every few weeks I chat with an industry buddy, quantity surveyor – Mike Mortlock. We enjoy analysing data; and more so, I like distilling the numbers with Mike and shedding light on what’s happening at the coal face to trigger the data that he’s produced. Mike is an industry thought leader who has recently produced an index that, when applied in combination with other metrics is particularly telling about the health of specific markets by postcode.
Mike’s ability to collate data from his tax depreciation business is fortuitous for investors who understand the relationship between rental vacancy rates and the supply of specific stock.
The MCG Quantity Surveyors Rental Loss Index was developed by Mike and his team in an effort to create an industry first rental index that highlighted the high risk investment locations.
“The MCG Quantity Surveyors Rental Loss Index highlights the top 10 suburbs in Australia, ranked by rental losses due to rental vacancies. The index uses total rental listings greater than 21 days for the suburb, multiplied by the suburbs aggregated median rent to provide a total rental lost index per suburb.”
In short, it’s a monthly index that highlights the suburbs around the nation experiencing the strongest rental vacancy rates. We’ve been privy to vacancy rate data in the past, but not quite as real-time, nor as specific as this particular data set.
Past chats with Mike since the index was launched generally hinged around Melbourne’s dire unit market performance; specifically the university-centric locations that had been hardest hit in response to our international border closure and Melbourne’s long-running lockdowns. In fact, up until September in Victoria every single suburb featuring in Mike’s top, (or should I say bottom) performers were university precincts featuring a disproportionate number of high-density apartments.
In September two quite dramatic changes showed up.
First and foremost, Melbourne decided not to take centre stage. Unlike past months where Melbourne’s sad state of affairs dominated Mike’s tables, this month it didn’t. Other cities took out the gong too.
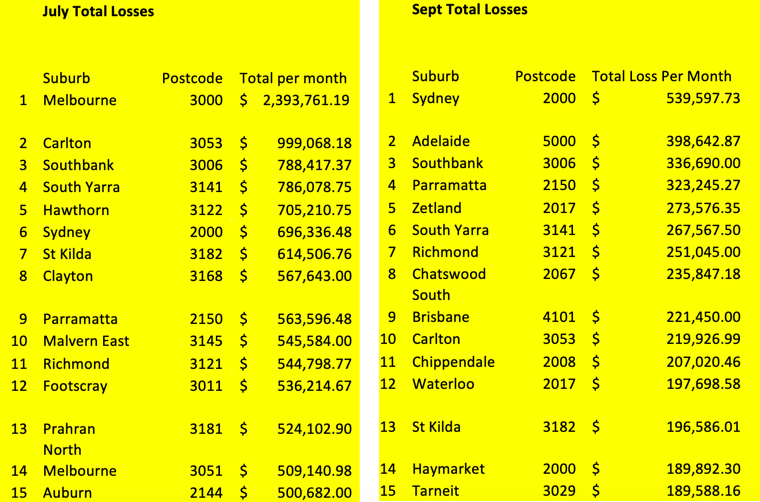
In July 2021, eleven out of the *bottom* fifteen suburbs were in Melbourne. For a national tally, this was quite telling. Past tables dating back to the launch in February 2021 all told a consistent story. Melbourne’s international student shortage was palpable across the board during our COVID-19 lockdown and border closure period. Not only were we not accepting international students, but two other factors were at play:
- Small one bedroom apartments were shunned by many renters as they seeked out either larger dwelling spaces to accommodate working from home, or moved further out, (or home with parents) in response to a pandemic that put the exciting city vibe on hold.
- An already-troubling oversupply of small, high density units was threatening Melbourne’s unit market.
The university precinct apartment markets remain troublesome for landlords who own apartments in these locales, however there is positive news for this investor contingent. The magnitude of the rental losses has diminished substantially since July, and is showing signs of a reasonable recovery. This trend is not what we’d have expected, and the explanation is quite interesting.
Many disenfranchised investors have opted to sell their under-performing assets and despite the white noise about apartment appeal, buyers are voting with their feet. Our supply and demand ratio is strongly in the vendors’ favour right now and these three charts from CoreLogic show what is really going on.
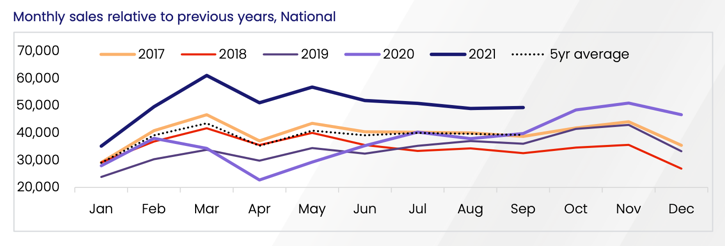
The first chart highlights the strength of our national market in terms of the number of sales currently being transacted, compared to the past five years. There is no doubt that 2021 sales volumes are significantly higher than past years;
In fact, they are more than double in some months.
The second and third charts show the intriguing twist. The left chart indicates that new listings are within the bounds of the previous five years’ of new listing numbers. The right chart, however shows that total listings are significantly lower; almost as low as half that of past years’ total listings.
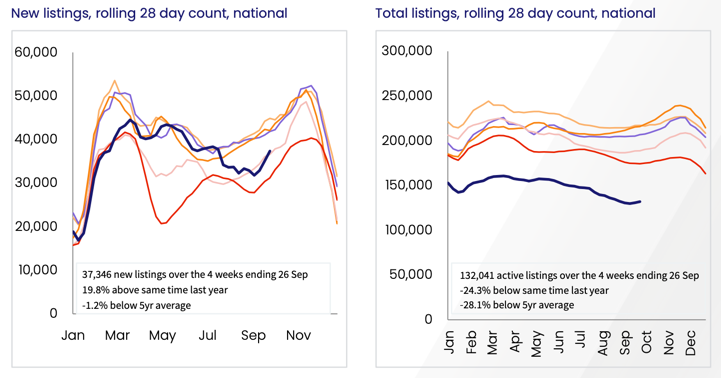
This clearly shows that buyer desperation is so strong, that they are prepared to buy the stock that has been floating around on the market for lengthy periods. Stock “days on market” is measured for capital cities in our nation, and the count of 180 days+ stock listings have been falling dramatically this year.
Buyers are now buying the stock from the bottom of the barrel.
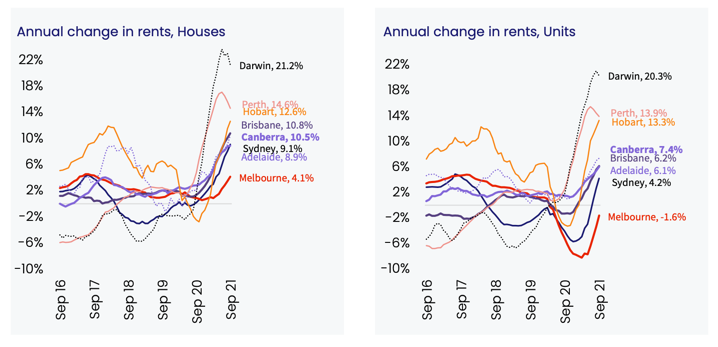
These buyers consist of home buyers and investors, but our city apartment take up by owner-occupiers is evident in these CoreLogic charts. Melbourne’s apartment market oversupply issue was amplified by COVID lockdowns and border closures, but as the chart on the right illustrates; the negative median rental movement is now firmly into recovery as Melbourne’s September quarter registers the unit rental market almost back to neutral price movement.
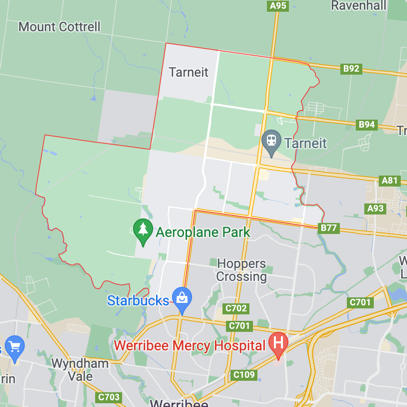
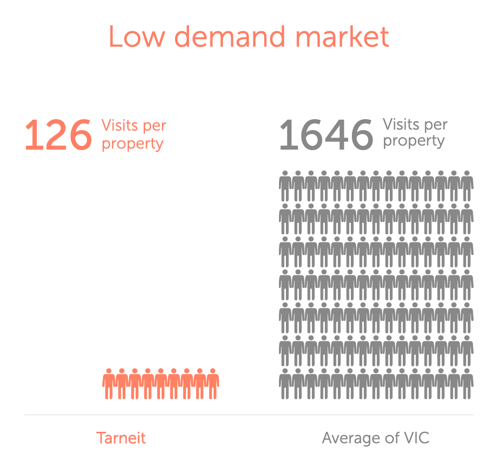
The second dramatic change is that of Tarneit’s rental losses.
The reason why Tarneit’s change caught my eye is because unlike every other Victorian suburb in Mike’s tables, Tarneit is not a university precinct, nor it is characterised by its apartment market. It has next to zero apartments and is broadly known for its house and land offering. Tarneit is a newish suburb in Melbourne’s western fringe and it’s plagued by badly-thought out infrastructure, (only recently furnished with a train station with insufficient numbers of parking bays) and cookie-cut, cheaply built homes that have consistently been pitched to investors and first home buyer markets.

Unfortunately for those investors who have targeted the suburb, their reasons for doing so have undermined the investment potential that they were seeking.
Many accountants and financial planners who pitch new house and land, (or new anything) for that matter, are usually doing so in an effort to help their clients maximise their tax deductions.
Sadly for the investor, the depreciation is so high that sometimes the property value declines in the first few years. This can be explained by a concept called “Land to Asset Ratio“. To compound the investor’s negative experience, the subdued rental demand in areas like Tarneit heighten their chances of rental vacancies or reduced asking rents.
The subdued rental demand is based on two main factors;
- A flood of similar properties, (and in turn, limited scarcity or point of difference for any one property), and
- An area that is more regarded for its affordability as opposed to its aspirational ability.
Commute challenges, limited suburb character and homogenous housing is always a threat for capital growth performance.
Buying house and land packages in a new suburb can be an exciting opportunity for a home buyer, but investors need to think very carefully about the appeal of a fringe suburb to their target tenant market. Paying particular attention to the Land to Asset Ratio, new building approvals, supply:demand characteristics, and rental vacancy movement is a valuable action for any investor.
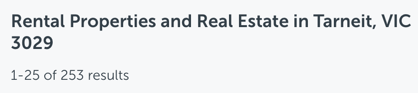
A quick check of available rental listings on a property search engine is a rudimentary start when it comes to mastering the fundamentals of good asset selection. Currently there are eleven pages of available rentals in this one suburb showing up on REA. That is indeed a troubling number and is no doubt creating a race to the bottom for investors who are desperately trying to lease out their properties.
The MCG Rental Loss Index is indeed a powerful tool and I’d like to thank Mike for sharing so generously with his community.

Mike and I discussed these findings on a live interview this week. The recording can be found here on Mike’s Geared for Growth podcast.
I interviewed Mike on @thepropertydiaries earlier this year. The episode can be found here.